
Figures & data
Table I. Biphasic production of early stage apoptotic platelets (ESAPs) by incubation of PRP with nanomolar (100–500 nM) and millimolar (0.2–0.5 mM) BzATP agonists
Table II. Production of early stage apoptotic platelets (ESAPs) by the P2X1 selective agonist αβ-me ATP
Figure 1. P2X7 expression on human platelets and circulating EVs. (a and b) Fluorescent histograms of P2X7 expression on human platelets and circulating EVs. GFP and platelet-derived EVs were incubated with AlexaFluor647-labeled P2X7 monoclonal antibody for 15 min at 25 °C and analyzed by flow cytometry. Histograms of isotype control antibody binding and autofluorescence are shown. (c and d) MFI of P2X7 mAb surface binding to platelets and EVs for five subjects; *p < .02 and **p < .005; and 23 subjects; ****p < .001. (e and f) Western analysis of P2X7 expression in platelet and EV lysates. The major P2X7 band migrates at 68–70 kDa with a lower molecular weight band thought to be deglycosylated receptor monomers. Additional lower MW bands present in PLT2, WBC2, and MP1 probably represent a splice isoform. Loading controls are not shown as there are no comparisons of relative amounts between cells and EVs. In (f), lanes designated MP (microparticle) are synonomous with EV. (g) Both P2X and P2Y agonists release EVs from platelets with maximum release by thrombin. Gel filtered platelets were incubated in K+ Tyrodes for 15 min with thrombin (1 U/mL), ADP (10 μM), MRS2365 (10 μM) and BzATP (0.5 mM). Released EVs were enumerated by flow cytometry. Mean and standard deviation shown for three experiments on separate donors, *p < .02, **p < .005, and ****p < .001.
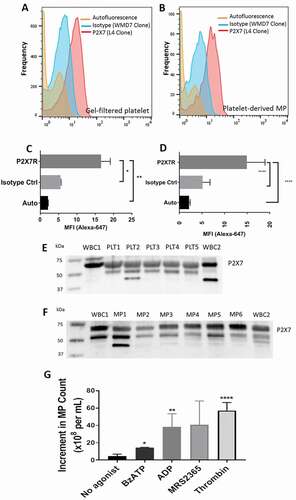
Figure 2. BzATP causes release of EVs containing functional mitochondria. (a) Early stage apoptotic platelets form a homogeneous population when identified with MitoTracker Deep Red and MitoTracker Green staining. Backgating the population within the polygon to the VSSC/FSC plot shows that early stage apoptotic platelets are among the larger of the EVs in size. The platelet integrin marker CD41 is expressed on MitoTracker positive apoptotic platelets but not on MitoTracker negative EVs. PRP was labeled with MitoTracker dyes, then incubated with BzATP (0.5 mM) for 10 min, centrifuged at 2500g for 15 min, and then supernate-labeled with CD41-PE. (b) ESAPs released from platelets by incubation with 100 nanomolar BzATP or by 1 μM ABT737 for 60 min are weakly positive for annexin V staining.
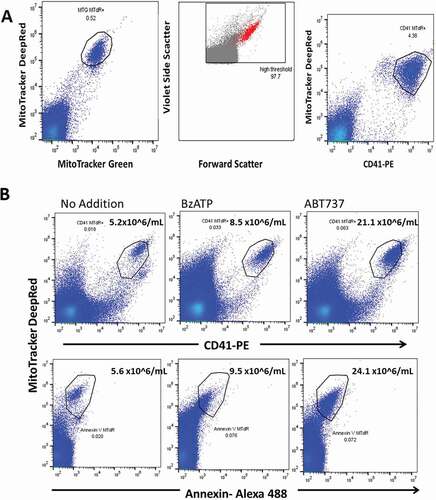
Figure 3. Early stage apoptotic platelets are produced by BzATP and by ABT737 but not by thrombin or by ADP. (a) Gel-filtered platelets were incubated with BzATP (0.5 mM) or with agonists thrombin (1.0 U/mL) or ADP (10 μM). Flow analysis of the cell-free supernate showed thatBzATP released MitoTracker+CD41+ ESAPs, which were not seen after ADP or thrombin incubations. Enumeration of ESAPs is shown above the polygon . (b) Incubation of platelets with ABT737 (1 μM) generates substantial production of MitoTracker + CD41+ ESAPs over 30–90 min incubation.
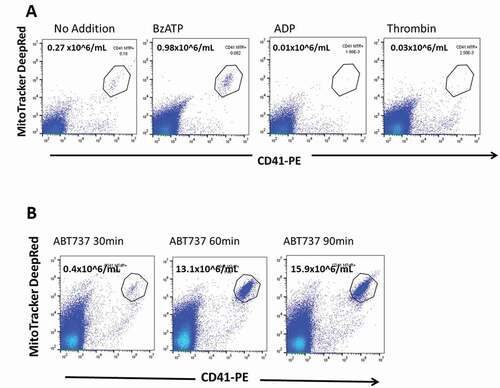
Figure 4. Release of early stage apoptotic platelets from PRP is BzATP dose-dependent . PRP was labeled with MitoTracker dyes and incubated for 10 min with BzATP at concentrations between 1.0 and 500 µM. Viable platelets were removed by centrifugation and ESAPs in supernate plasma enumerated by flow cytometry. The graph shows the mean ± SD from 3 or 4 normal donors.
Figure 5. The physiological agonist ATP and the P2X1 selective agonist αβ-meATP both release early stage apoptotic platelets from PRP. (a) PRP was incubated with ATP for 10 min at 37 °C and centrifuged, followed by analysis of the supernate for ESAPs. Maximum values of ESAPs are seen at 50 nM ATP. (b and c) PRP was preincubated with apyrase 0.2 U/mL for 60 min and then with αβ-meATP for 10 min at 37 °C .Strong agonist responses are seen at 200 and 500 nM agonists, which almost disappear at 1uM agonist due to receptor desensitization. (c) Agonist responses are blocked by preincubation of PRP with latrunculin A, which blocks subsequent progression to apoptosis. ESAP numbers in the supernate are expressed as number x 106/mL plasma.
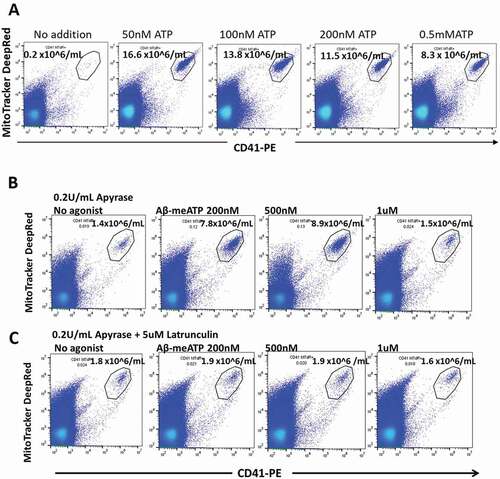
Table III. Effect of lipid raft inhibitors on the production of ESAPs by brief incubation of PRP with BzATP