Figures & data
© 2021 The Author(s). Published with license by Taylor & Francis Group, LLC.
Table I. Reference intervals for platelet activity assays in pregnant women taking low-dose aspirin. (Separate intervals were derived for Randox for pregnant women at high risk of preeclampsia versus those at low risk, from the Liverpool and Dublin cohorts, respectively).
Figure 1. Distribution of individual patient results for urinary 11-dehydrothromboxane B2 (11DTXB2) (Randox laboratories). The three groups contain all three gestational ages included in the study.
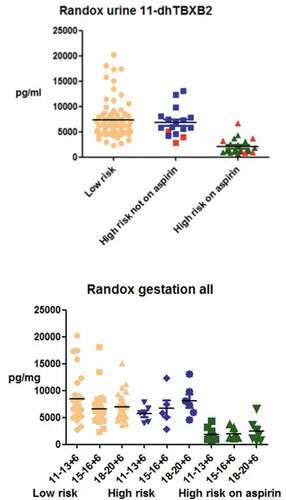
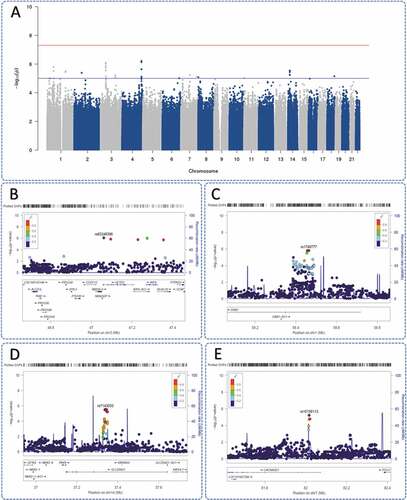
Figure 2. GWAS meta-analysis findings of Liverpool and Dublin pregnancy cohorts using METAL software (Willer et al., 2010). a) Manhattan plot urinary 11-dehydrothromboxane B2 measures of aspirin compliant patients (n = 182). The top red threshold indicates genome-wide significance threshold of p < 5 x 10⁻⁸, the lower blue threshold indicates suggestive threshold p < 1 x 10⁻⁵. R package, qqman, was utilized to produce this Manhattan plot (Turner, 2018). Regional plots generated using LocusZoom (Pruim et al., 2010): b) chromosome 3 (rs62246396, SETD2); c) chromosome 1 (rs1749777, DAB1) indicating multiple SNPs in linkage disequilibrium; d) chromosome 14 (rs7143033, SLC25A21); and e) chromosome 7 (rs10156113, CACNA2D1) with several SNPs in linkage disequilibrium.