Figures & data
Table I. Summary of PAR4 binding peptides and their agonist activities in FLIPR calcium mobilization assay and 96-well platelet aggregation assay.
Figure 1. A-Phe(4-F)-PGWLVKNG peptide induced PAR4 activation in HEK293-PAR4 cells and human platelets. (a) Representative FLIPR tracing of A-Phe(4-F)-PGWLVKNG- and AYPGKF-induced calcium mobilization in HEK293-PAR4 cells. To control for the cell population in each experiment and between conditions, both peptides were used at EC80. (b) Representative FLIPR tracing of A-Phe(4-F)-PGWLVKNG (11 µM) -induced calcium mobilization in HEK293-PAR4 cells versus HEK293 parental cells. (c) Representative FLIPR tracing of A-Phe(4-F)-PGWLVKNG versus PAR1 AP (SFFLRR)-induced calcium mobilization in human platelets. Both peptides were used at 12.5 µM. Results from A, B, C represent data from n ≥ 2. (d) Comparison of a set of 178 small-molecule PAR4 antagonist activities in the calcium mobilization assay performed using HEK293-PAR4 cells stimulated with either A-Phe(4-F)-PGWLVKNG or AYPGKF at EC50. Correlation analysis was performed using GraphPad Prism software and the Spearman rs and P values are given.
Figure 2. PAR4 AP evaluation in LTA platelet-aggregation assays. (a) PAR4 AP concentration responses in LTA platelet-aggregation assay. A-Phe(4-F)-PGWLVKNG or AYPGKF were tested side-by-side using the Chrono-Log instrument. The EC50 values were calculated from 4 parameter non-linear regression curve fit of 9 to 10 independent replicates using GraphPad Prism 7.02 software. (b) Comparison of Chrono-Log versus Bio/Data instruments in measuring human PRP responses to A-Phe(4-F)-PGWLVKNG. Results represent average of data from 5 donors. Error bars indicate standard error of the mean.
Table II. Summary of Chrono-Log LTA platelet-aggregation assay performance using PAR4 AP (A-Phe[4-F]-PGWLVKNG) tested at 12.5 μM.
Table III. Summary of working solution stability of PAR4 AP for platelet aggregation.
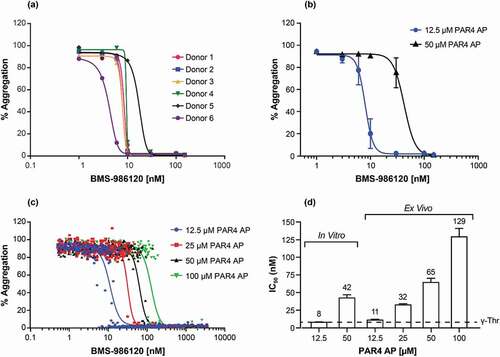
Figure 3. Concentration-dependent inhibition of PAR4 AP (A-Phe(4-F)-PGWLVKNG) -induced platelet aggregation by BMS-986120 using LTA platelet-aggregation assay. (a) In vitro concentration responses of BMS-986120 to 12.5 µM PAR4 AP A-Phe(4-F)-PGWLVKNG from individual donors are shown. Isolated PRP was treated with BMS-986120 for 60 minutes and stimulated with 12.5 µM PAR4 AP A-Phe(4-F)-PGWLVKNG. (b) The average in vitro concentration responses and standard error of means of BMS-986120 are shown (n = 6 donors per group). Isolated PRP was treated with BMS-986120 for 60 minutes and stimulated with 12.5 µM and 50 µM PAR4 AP A-Phe(4-F)-PGWLVKNG. (c) Ex vivo concentration responses of BMS-986120 to PAR4 AP A-Phe(4-F)-PGWLVKNG are shown (n = 42 donors). BMS-986120 was administered to healthy volunteers as described in the method and PRP samples were collected and stimulated with PAR4 AP A-Phe(4-F)-PGWLVKNG at 12.5 µM, 25 µM, 50 µM and 100 µM. (d) The calculated IC50 values from in vitro (B) and ex vivo (C) tests are displayed. The IC50 values are indicated and were derived from four parameter nonlinear regression curve fit using GraphPad Prism 7.02 software. The dashed line indicates historical in vitro potency of BMS-986120 in PRP-aggregation assay stimulated with γ-thrombin (γ-Thr).5