
Figures & data
Figure 1. The potential and limitations of the different ways to report platelet activation responses, the percentage positive platelets (“%Gated,” red boxes), median fluorescence intensity (“X-Med,” blue boxes) and variation of the fluorescence response (“X-CV,” Orange boxes), as illustrated with (A) a sample with low activation (resting platelets, P-selectin as activation marker), (B) a sample with moderately activated platelets (fibrinogen binding as activation marker) and (C) a sample with strongly activated platelets (P-selectin as activation marker). Results for “All” refers to all particles within the “All platelets” gate shown in Figure 2.
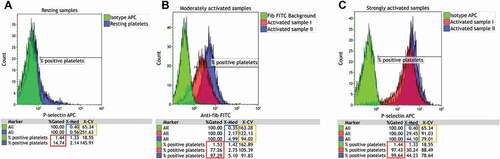
Figure 2. The gating strategy used for analysis of the PCs in this study. PE-positive particles were collected using a threshold on FL2 at acquisition. The single platelets were identified based on FS height and area (A) and then distinguished from platelet fragments through PE fluorescence (B) with a platelet gate big enough to include also platelets with a change in forward scatter due to activation and procoagulant transformation. The setting of the gate for P-selectin positive platelets as close as possible to 1.5% with the use of the negative (isotype antibody) control sample (C). Data obtained from an activated sample containing P-selectin antibody when the above presented gating strategy was used (D).
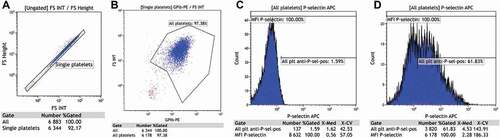
Table 1. Median, confidence interval (CI) and p-value for apheresis and IPU with all tested agonists and markers. Significant results are marked in bold.
Table 2. Impact of the number of platelet events investigated on the flow cytometry variables.
Data availability statement
The raw data used for this publication can be provided by the authors upon reasonable request.