Figures & data
Table I. Patient characteristics.
Figure 1. Circulating platelets are activated in pulmonary arterial hypertension patients. A) The number of platelets and B-C) their activation state were assessed in healthy controls (HC, N = 20) and PH patients (N = 48) by flow cytometry as described in Methods. A two-tailed Mann-Whitney test was used to calculate p-values. MFI = Mean fluorescence intensity. ** = p < .01 *** p < .001.
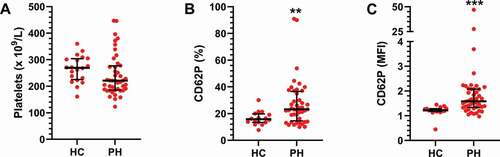
Figure 2. Circulating platelets do not differ across pulmonary hypertension subgroups. The cohort was divided into subgroups based on clinical diagnosis: IPAH (N = 26), APAH (N = 11), CTEPH (N = 11) and healthy controls (HC, N = 20). A) The number of platelets and B-C) their activation state were then assessed by flow cytometry, as described in Methods, and compared across the patient groups using a Kruskal–Wallis test. MFI = Mean fluorescence intensity. ns = not significant.
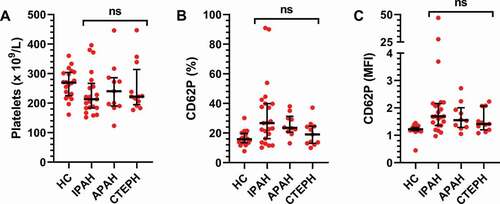
Figure 3. Platelet monocyte and platelet granulocyte aggregates are increased in PH patients. The numbers of A) platelet monocyte aggregates (PMA) and B) platelet granulocyte aggregates (PGA) were assessed in healthy controls (HC, N = 20) and PH patients (N = 48) by flow cytometry as described in Methods. A two-tailed Mann–Whitney test was used to calculate p-values. *** p < .001.
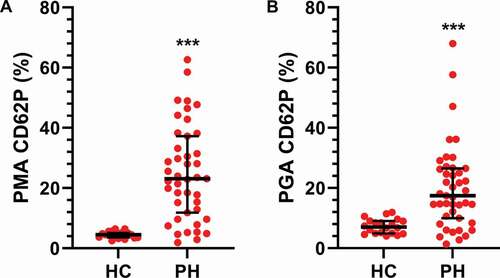
Figure 4. Platelet monocyte- and platelets granulocyte aggregates do not differ across PH subgroups. The cohort was divided into subgroups based on their clinical diagnosis: IPAH (N = 26), APAH (N = 11), CTEPH (N = 11) and healthy controls (HC, N = 20). The numbers of A-B) platelet monocyte aggregates (PMA) and C-D) platelet granulocyte aggregates (PGA) were assessed by flow cytometry, as described in Methods, and compared between the patient groups using a Kruskal–Wallis test. MFI = Mean fluorescence intensity. ns = not significant.
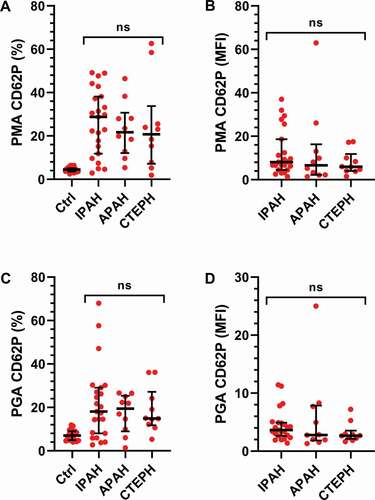
Figure 5. Inflammatory proteins are increased in PH patient plasma. Proinflammatory proteins were analyzed by electrochemiluminescence in plasma from healthy controls (HC, N = 20) and PH patients (N = 48) as described in Methods. Group differences were determined using a two-tailed Mann–Whitney test. ** = p < .01 *** p < .001.
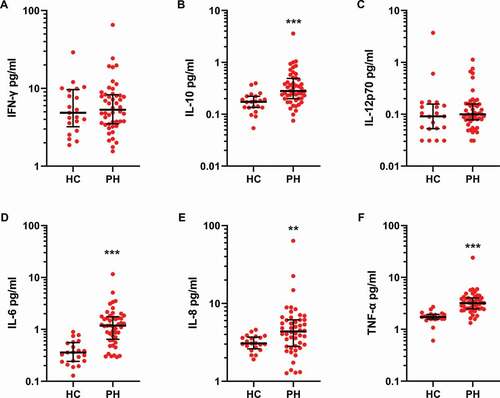
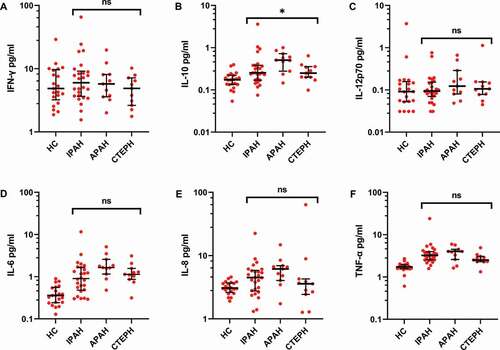
Figure 6. Subgroup analysis of inflammatory proteins in PH patient plasma shows small differences. The cohort was divided into subgroups based on their clinical diagnosis: IPAH (N = 26), APAH (N = 11), CTEPH (N = 11) and healthy controls (HC, N = 20). Proinflammatory proteins were analyzed by electrochemiluminescence in plasma, as described in Methods, and compared across the patient groups using a Kruskal–Wallis test. * = p < .05.