
Figures & data
Figure 1. Plasma concentration‒time profiles of BMS-986120.
Participants were dosed with a single administration of BMS-986120 ranging from 0.3 to 180 mg. Blood samples were taken predose and 0.5, 1, 1.5, 2, 2.5, 3, 4, 5, 6, 9, 12, 24, 36, 48, 72, 96, 120, and 144 hours postdose for pharmacokinetic assessment. (a) Results from the single-ascending oral dose (SAD) study shown on linear scale. (b) Results from the SAD study shown on log-linear scale. (c) Concentration‒time profiles from day 14 of the multiple-ascending oral dose (MAD) study shown on log-linear scale. Lower limit of quantification (LLOQ) indicates 0.250 ng/mL; <LLOQ values were treated as “missing” for calculation of mean values.
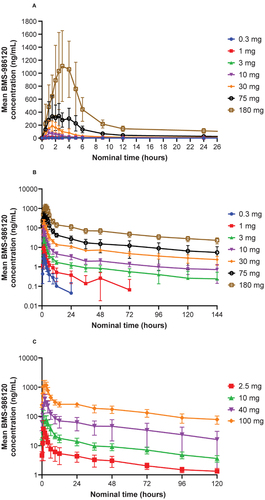
Table I. Pharmacokinetics.
Figure 2. Induced platelet aggregation in the multiple-ascending dose (MAD) study.
Within each dose panel (2.5, 10, 40, or 100 mg), eight participants were randomly assigned to receive QD BMS-986120 or matched placebo for 14 days. Blood samples were taken on day 1 predose and 0.5, 1, 2, 3, 4, 6, 9, and 12 hours postdose; predose on days 2, 4, 7, 10, and 13; day 14 predose and at 0.5, 1, 2, 3, 4, 6, 9, 12, 24, 36, 48, 72, 96, 120, and 144 hours postdose. (a) 12.5 µM PAR4-AP. (b) 25 µM PAR4-AP. (c) 50 µM PAR4-AP. (d) 100 µM PAR4-AP. (e) 25 µM PAR1-AP. PAR4-AP (A-Phe[4-F]-PGWLVKNG) was used to induce platelet activation and aggregation. PAR1-AP (SFFLRR) was used to show selectivity of platelet aggregation to PAR4.
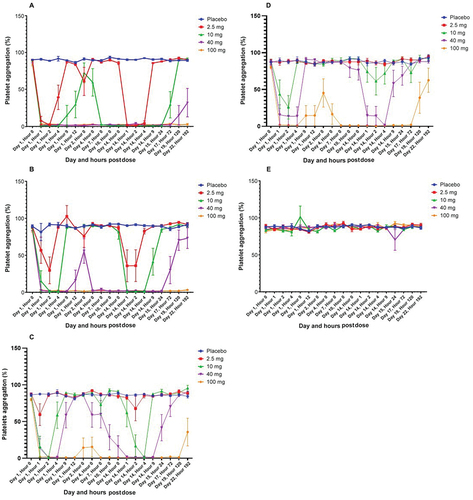
Figure 3. Platelet aggregation responses to PAR4-AP by self-identified race.
Data from both the SAD and MAD studies were pooled and analyzed by self-identified race to generate platelet aggregation responses across a range of PAR4-AP concentrations. (a) 12.5 µM PAR4-AP. (b) 25 µM PAR4-AP. (c) 50 µM PAR4-AP. (d) 100 µM PAR4-AP. PAR4-AP (A-Phe[4-F]-PGWLVKNG) was used to induce platelet activation and aggregation. Line was determined by 4-parameter equation.
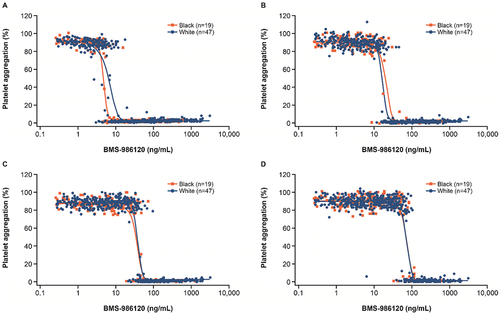
Figure 4. Inhibition of human platelet aggregation by BMS-986120 in participants sorted by PAR4 A120T variants.
Data from both the SAD and MAD studies were pooled and analyzed by PAR4 genotype to generate platelet aggregation inhibition response curves across a range of PAR4-AP concentrations. (a) 12.5 µM PAR4-AP. (b) 25 µM PAR4-AP. (c) 50 µM PAR4-AP. (d) 100 µM PAR4-AP. A total of 24 participants had the AA variant, 31 had the AT variant, and 11 had the TT variant. PAR4-AP (A-Phe[4-F]-PGWLVKNG) was used to induce platelet activation and aggregation. Line was determined by 4-parameter equation.
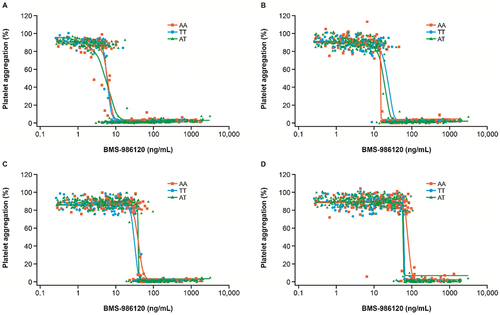
Figure 5. Influence of A120T variants on PAR4-AP-induced calcium mobilization.
PAR4-AP-induced calcium mobilization assays were conducted using HEK293 cells expressing either A120 or T120 PAR4 protein variants to determine mean effective concentration values. (a) Representative PAR4-AP concentration–response. (b) Summary of PAR4-APEC50. PAR4-AP (A-Phe[4-F]-PGWLVKNG) was used to induce platelet activation and aggregation. CI, confidence interval; EC50, median effective concentration; RFU/ATP, relative fluorescence units/adenosine triphosphate; SEM, standard error of the mean. Data analysis was done using GraphPad Prism: log(agonist) vs response, variable slope 4-parameters.
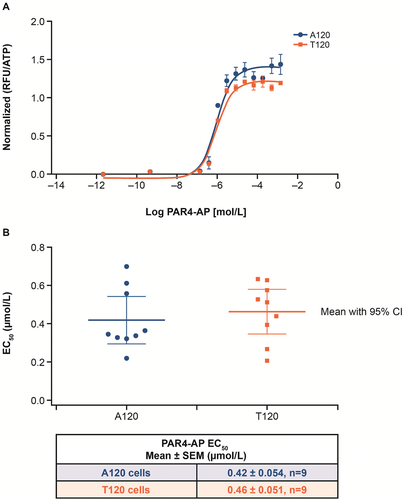
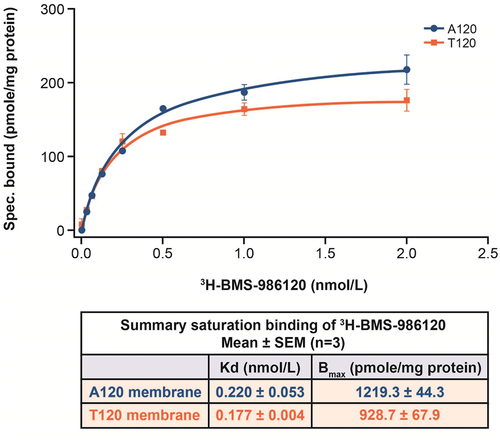
Figure 6. Saturation binding of 3H-BMS-986120.
A membrane preparation from cells expressing either A120 or T120 PAR4 was used to calculate Bmax. (a) Representative graph of saturation 3H-BMS-986120 binding. (b) Summary table of saturation binding of H3-BMS-986120. Bmax, maximum specific binding; SEM, standard error of the mean; Spec., specific. Data analysis was done using GraphPad Prism: binding saturation one site-total and nonspecific binding.
Supplemental material
Supplemental Material
Download PDF (418.9 KB)Data availability statement
Requests to access the dataset from qualified researchers trained in human participant confidentiality protocols may be made via Bristol Myers Squibb’s online request system at https://fasttrack-bms.force.com/.