Figures & data
Figure 1. Platelets immobilized on plastic surface in 96-well plates. Washed platelets (0.5 x 10⁸/ml) were not activated (a) or activated by 0.2 mM arachidonic acid (b) or 10 µm A23187 (C) without stirring for 5 min at room temperature and spun down on the bottom of 96-well plates (100 µl/well) at 1500 g, 5 min. (see “Materials and methods”). The supernatant was removed; platelets were fixed with 1% paraformaldehyde and analyzed in a phase-contrast microscope. Scale bar −10 µm. Close pictures were obtained after platelet activation by arachidonic acid (b) and ADP and collagen (not shown). After activation by A23187 most platelets acquire a rounded shape.
Figure 2. Effects of platelets on fibrin formation in modified PRA. Platelets were not activated by exogenous agonists (“No exo agonists”) or activated by 20 µM TRAP (“TRAP”), 20 µM ADP (“ADP”), 0.2 mM arachidonic acid (“Arach acid”), 10 µg/ml collagen (“Collagen”) or 10 µM A23187 (“A23187”) and spun down in 96-well plates. Platelets were not added to the control samples (“No platelets”). After plasma addition, PRA was performed as described in “Materials and methods.” Representative curves out of ≥ 8 experiments. Statistical data are given in .
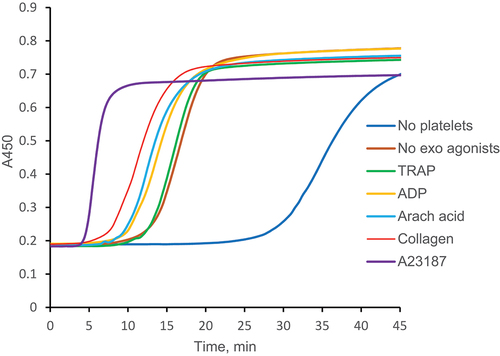
Table I. Platelet activation and fibrin formation in a PRA.
Figure 3. Effects of platelets on thrombin generation in TGT. Platelets were not activated by exogenous agonists (“No exo agonists”), or activated by 20 µM TRAP (“TRAP”), 20 µM ADP (“ADP”), 0.2 mM arachidonic acid (“Arach acid”), 10 µg/ml collagen (“Collagen”) or 10 µM A23187 (“A23187”) and spun down in 96-well plates. Platelets were not added to the control samples (“No platelets”). TGT was performed as described in “Materials and methods.” Representative curves out of ≥ 7 experiments. Statistical data are given in .
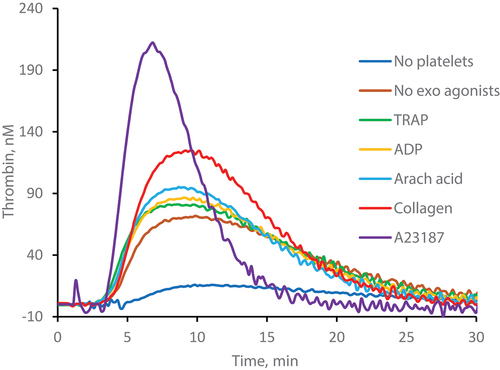
Table II. Platelet activation and thrombin generation.
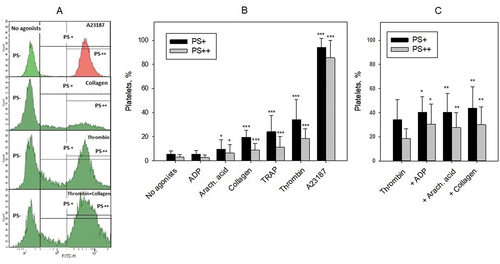
Figure 4. Platelet activation and PS expression. Platelets were not activated (No agonists) or activated by indicated agonists and PS was detected by staining with annexin V-FITC using flow cytometry. Thrombin was used in a concentration of 10 U/ml, and other agonists (A23187, TRAP, collagen, arachidonic acid and ADP) in the same concentrations as in recalcification assay ( and ) and TGT ( and ). (A) Examples of flow cytometry analysis. Fluorescence regions for PS-, PS+, and PS++ platelets are shown. Vertical line separating PS- and PS+ regions corresponds to 95% of the fluorescent peak of the negative control (platelets without annexin V-FITC, not shown). Vertical line separating PS+ and PS++ regions corresponds to the 95% of the fluorescent peak of A23187 activated platelets (to the right). (B) Amounts of PS+ (black bars) and PS++ (gray bars) platelets after their activation with the agonists. Means ± SD (n ≥ 9) are shown; *p < 0.05, ***p < 0.001, significance of differences from “No agonists” group (t-test for means). (C) Amounts of PS+ (black bars) and PS++ (grey bars) platelets after their activation by thrombin alone and by thrombin in combination (+) with ADP, arachidonic acid and collagen. Means ± SD (n ≥ 11) are shown; *p < 0.05, **p < 0.001, significance of differences from “Thrombin” group (paired t-test).