Figures & data
Figure 1. IC stimulated platelets to produce similar numbers of PMPs with increased NLRP3. A. PSS nanoparticle size analysis of PMPs treated with IC for 30 min. B. Flow cytometry analysis of PMPs, which were double positive for CD41a-PE and Annexin V-FITC. C. Quantification of PMPs per μL. The PMP counts/μL between Thrombin-PMPs, Ctrl-PMPs and IC-PMPs. D. Western blot analysis of NLRP3 in PMPs treated with IC for 30 min. E. Quantification of NLRP3 protein levels. β-actin was used as an internal control. Data were presented as the means ± SD, n = 3. *P <.05, **P <.01, and ***P <.001 vs. the corresponding IC-PMPs group; ns, P >.05, no significant difference.
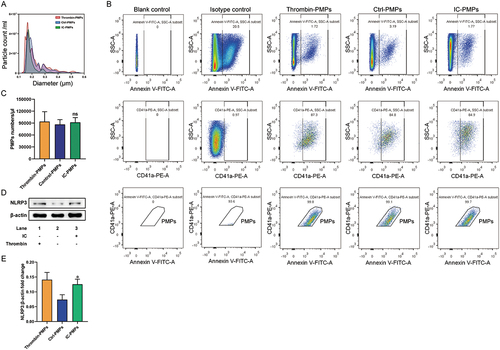
Figure 2. Expression of pyroptosis protein was detected in different stimulations and the phenomenon of internalized PMPs. A. Western blot analysis of GSDMD-N in endothelial cells treated with PMPs produced by stimulation with IC for 30 min, 1 h, 2 h, 4 h, 6 h and 8 h. B. Western blot analysis of GSDMD-N in endothelial cells treated with PMPs stimulated by LPS, thrombin, PBS, IgG, and IC for 6 h. β-actin was used as an internal control. C. Immunofluorescence analysis of Caspase-1 p20 (green) in endothelial cells as observed through each group. D. Immunofluorescence analysis of GSDMD-N (red) in endothelial cells as observed through each group. Scale bar is 50 µm.
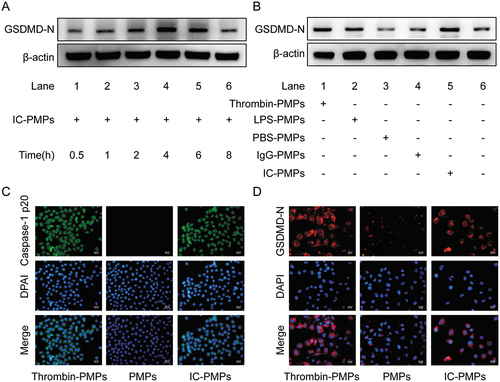
Figure 3. Detection of NF-κB, GSDMD and GSDMD-N in endothelial cells stimulated by PMPs for 6 h. A. Western blot analysis of NF-κB and p-NF-κB in endothelial cells treated with PMPs produced by stimulation with IC for 6 h. B. Quantification of p-NF-κB/NF-κB protein levels. C. Measurement of extracellular Caspase-1 activity in endothelial cells. D. Western blot analysis of GSDMD and GSDMD-N in endothelial cells treated with PMPs produced by stimulation with IC for 6 h. E-G. Quantification of GSDMD and GSDMD-N protein levels. β-actin was used as an internal control. H. Immunofluorescence analysis of GSDMD-N (red) in endothelial cells as observed through each group. Scale bar, 50 μm. Data were presented as the means ± SD, n = 3.*P <.05; **P <.01; ***P <.001; ns, P >.05, no significant difference.
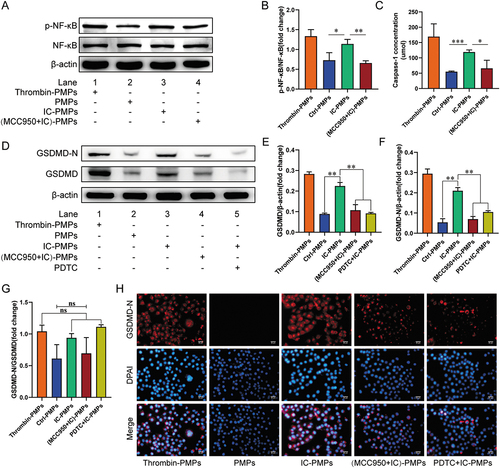
Figure 4. Caspase-1, Caspase-1 p20, il-1β and IL-18 were measured in endothelial cells stimulated by PMPs. A. Western blot analysis of Caspase-1 and Caspase-1 p20 in endothelial cells treated with PMPs produced by stimulation with IC for 6 h. B. Quantification of the Caspase-1 p20/caspase-1 fold change. β-actin was used as an internal control. C. Immunofluorescence analysis of Caspase-1 p20 (green) in endothelial cells as observed through each group. Scale bar, 50 μm. D-E. ELISA analysis of the levels of secreted IL-1β and IL-18. Data were presented as the means ± SD, n = 3.*P <.05; **P <.01; ***P <.001; ns, P >.05, no significant difference.
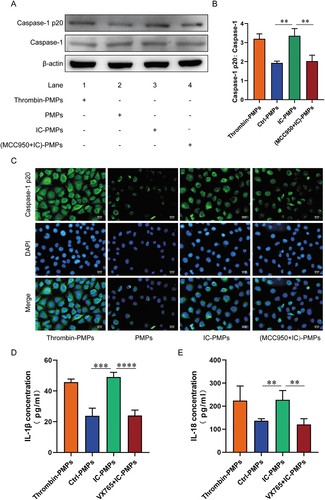
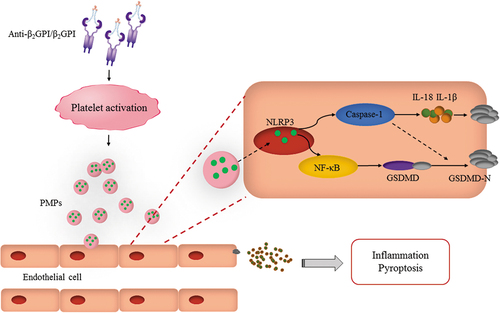
Figure 5. Schematic diagram of the role and mechanism of IC-PMPs on the induction of endothelial cell pyroptosis. In APS, PMPs released from activated platelets are internalized by endothelial cells during hyper-IC stimulation. NLRP3 within PMPs is released, and endothelial cell pyroptosis and inflammatory responses are induced via the NLRP3/NF-κB/GSDMD and NLRP3/Caspase-1 signaling pathways, which are involved in the mechanism of thrombosis in patients with APS.