
Figures & data
Figure 1. Illustration of gating strategies to detect platelet subpopulations. The dot plots depict the formation of platelet subpopulations, exemplified by a whole blood sample from a healthy individual, before and after stimulation with same agonists as used for the platelet concentrates. a: Spontaneously activated platelets (with HEPES instead of agonist). b: Platelets activated with a combination of CRP-XL (1.33 µg/mL) + PAR1-AP (30 µm) + PAR4-AP (300 µm).
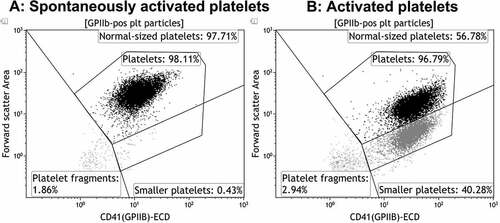
Figure 2. Examples of flow cytometry dot plots from platelet units with high and low level of platelet fragmentation at day 1. a, c: Spontaneously activated (with HEPES instead of agonist). b, d: platelets activated with a combination of CRP-XL (1.33 µg/mL) + PAR1-AP (30 µm) + PAR4-AP (300 µm).
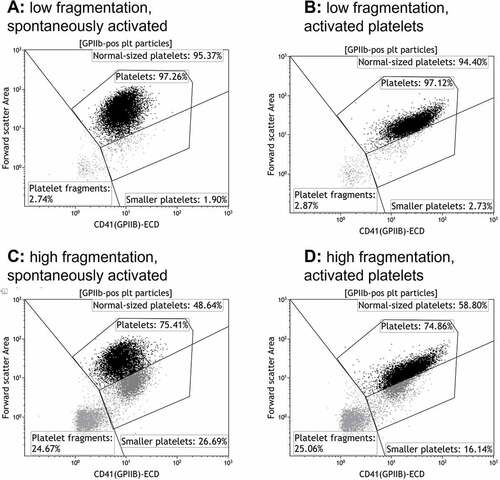
Table I. Platelet subpopulations in PCs on day 1 of storage.
Table II. Expression of activation markers on all platelets and platelet subpopulations on day 1 of storage.
Table III. Aggregation and coagulation response of platelets in PCs with high and low fragmentation.
Figure 3. Spontaneous exposure of platelet activation markers during storage in PCs with initially high (n = 5) and low (n = 5) platelet fragmentation. The result is for CD41+ events of normal- and small size. The bars show median values and error bars the interquartile ranges. */** = p <.05/0.01 compared to day 1 for low- and high fragmentation, respectively. #/## = p <.05/0.01 as compared to PCs with low fragmentation.
Figure 4. Activation-induced response in PCs with initially high (n = 5) and low (n = 5) platelet fragmentation. The result is for CD41+ events of normal- and small size. The bars show median values and error bars the interquartile ranges. */** = p <.05/0.01 compared to day 1 for low- and high fragmentation, respectively. # = p <.05 as compared to PCs with low fragmentation. The activation-induced response was calculated where the percentage for the non-agonist stimulated samples (i.e., with HEPES) was subtracted from the percentage of the agonist-stimulated samples.
Supplemental Material
Download PDF (155.3 KB)Data availability statement
The data that support the findings of this study are available from the corresponding author upon reasonable request.