Figures & data
Figure 1. Flow cytometry analysis of CD36 expression on platelets and monocytes. Top panels: Platelets from a normal individual (positive control); individuals with types I and II deficiencies were stained with fluorescence-labeled anti-CD41 (PE) and anti-CD36 (FITC). After washings, platelets were subjected to flow cytometry analysis using unlabeled platelets as negative controls. Bottom panel: monocytes were isolated from the same individuals and labeled with fluorescence anti-CD14 (PE) and anti-CD36 (FITC) and subjected to flow cytometry analysis as above.
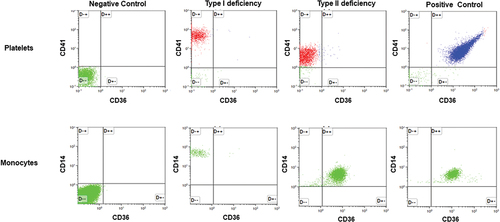
Figure 2. DNA sequencing analysis of individuals with type I (n = 1) and type II (n = 5) CD36 deficiency. Genomic DNA was isolated and subjected to polymerase chain reaction (PCR) amplification using two primer pairs mentioned in the methods were subsequently analyzed using nucleotide sequencing. The heterozygous mutations (*) detected in the type I individual (I.1) and five type II individuals (II.1–5) are shown. The position of the mutations/deletions are indicated by arrows.
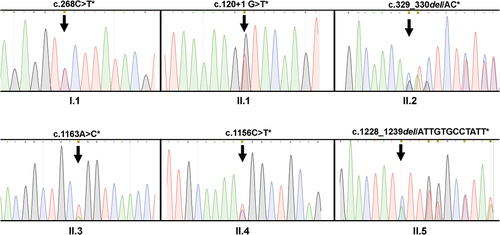
Table I. Summary of the naturally occurring mutations in individuals with CD36 deficiency.
Figure 3. Sequencing analysis of cDNA from platelets and monocytes derived from individuals with type I (n = 1) and type II (n = 3) CD36 deficiency. Platelet (Plt) and monocyte (Mon) cDNA was amplified using PCR (see Materials and Methods) and subjected to nucleotide sequencing analysis, as described above. Please note that only mutant transcripts were found in the platelets and monocytes of type I individuals. In type II individuals, mutant transcripts were also detected in platelets, whereas monocytes harbored both mutant and wild-type transcripts.
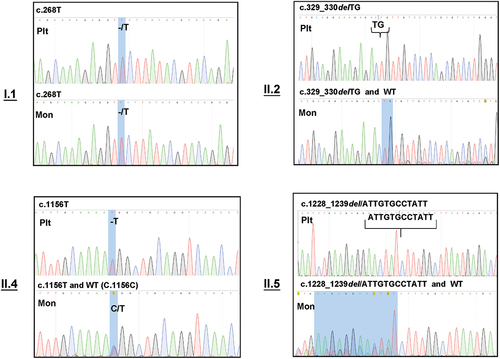
Table II. Summary of the DNA and cDNA sequencing analysis of individuals with CD36 deficiency.
Figure 4. Electrophoresis analysis of PCR products from platelet and monocyte cDNA encompassing exons 1–5 and 5–15. Platelet (Plt) and Monocyte (Mon) cDNA was amplified using PCR (see Materials and Methods) and analyzed with 2% gel electrophoresis using a molecular weight standard as a marker. (A): electrophoresis analysis of exons 1–5, normal transcript (P0), and alternative splice products (P1–P5) are shown; (B) electrophoresis analysis of exons 5–15; the figure shows only one normal band (P0*) in both Plts and Mons.
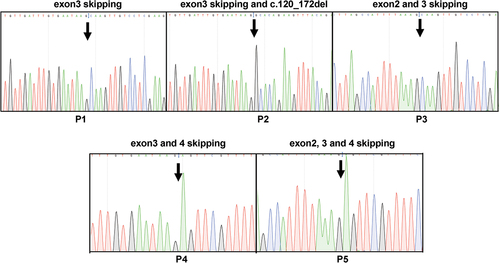
Figure 5. Analysis of alternatively spliced products from type I and II deficiency. PCR products comprising different alternative products (P1–P5) were isolated from the gel, cloned, and sequenced from two directions. The skipping of different exons found in P1, P2, P3, P4, and P5 and mutations are shown.