Figures & data
Figure 1. Schematic of experimental setup and workflow. Femora and tibiae were prepared from mice and cells harvested by spinning out the BM [Citation19]. An RBC lysis is an optional step to remove undesired cells (steps 1–11). The BM single-cell suspension is filtered through a 70 µm cell strainer to remove leftover hair and bone (steps 12–14) after RBC lysis. The BM fraction is filtered through a 20 µm cell strainer and the flow through is collected (FT I). FT I is additionally filtered through a 20 µm filter. MK I and II flow through fractions are combined (steps 15–22) and filtered through a 15 µm cell strainer to obtain FT III and MK III. Next, MK III is transferred into a new conical tube, which reflects the final MK fraction (steps 23–28). The bright field images are representative from at least five independent experiments. Scale bar represents 60 µm.
![Figure 1. Schematic of experimental setup and workflow. Femora and tibiae were prepared from mice and cells harvested by spinning out the BM [Citation19]. An RBC lysis is an optional step to remove undesired cells (steps 1–11). The BM single-cell suspension is filtered through a 70 µm cell strainer to remove leftover hair and bone (steps 12–14) after RBC lysis. The BM fraction is filtered through a 20 µm cell strainer and the flow through is collected (FT I). FT I is additionally filtered through a 20 µm filter. MK I and II flow through fractions are combined (steps 15–22) and filtered through a 15 µm cell strainer to obtain FT III and MK III. Next, MK III is transferred into a new conical tube, which reflects the final MK fraction (steps 23–28). The bright field images are representative from at least five independent experiments. Scale bar represents 60 µm.](/cms/asset/485a509c-ae2e-4774-9177-b87abb14fb66/iplt_a_2192289_f0001_oc.jpg)
Figure 2. Purity and ploidy analysis by flow cytometry of size-exclusion enriched MKs. (Ai) Representative gating strategy for MK purity analysis based on FSC and SSC characteristics with the percentage of cells in the respective gates. (Aii) Quantification of the percentage of cells in the MK gate based on FSC and SSC characteristics. For each data point, the BM cells of 3–4 mice were combined and filtered. Values are mean ± s.d. (Bi) Representative gating strategy for MK purity analysis based on double positive expression of CD42a and CD41/CD61 with the percentage of cells in the respective gates. (Bii) Quantification of the percentage of cells in the MK gate based on double positive expression of CD42a and CD41/CD61. For each data point, BM cells of 3–4 mice were combined. Values are mean ± s.d. (C) Quantification of the percentage of cells in the MK gate based on FSC and SSC characteristics and double positive events (CD41+/CD42a+) before (BM) and after enrichment (non-MK fraction and MK fraction) via BSA gradient. Each data point represents cells from one mouse. Values are mean ± s.d. (D) Percentage overview of different cell population in A, B and C from the bone marrow (BM), flow through (FT) or non-MK and MK fraction enriched via size exclusion (A and B) and BSA gradient (C). Values are mean ± s.d. out of three independent experiments. In the last column, the factor of enrichment (en) or removal (re) was calculated based on the ratio of MK to BM (“enrichment,” green) or of BM to MK (“removal,” red). (E) Left: Representative ploidy analysis and gating strategy of BM, FT and size-exclusion enriched MKs by flow cytometry. SYTOX blue-positive cell populations were gated for CD41/61 expressing MKs. The histogram of SYTOX™ blue Dead Cell Stain intensities was divided to separate MKs with ploidy level of 2N-8N from those cells with≥16N. The percentages of one representative experiment are shown. Right: Quantification of the ploidy analysis shown on the left. Each data point represents one experiment from one mouse. Values are mean ± s.d.
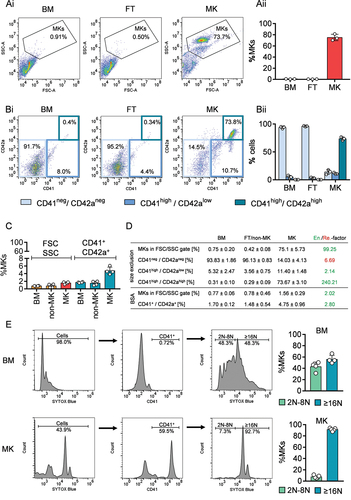
Figure 3. Representative confocal images of purified MKs. (A) MKs were stained for CD41/CD61 CLEC-2, GPVI, CD42a, CD42b, CD42d and the nucleus after enrichment. Scale bar represents 50 µm. (B) Staining of F-actin (Phalloidin-Atto 647) and CD42a of MKs in the enriched fraction. Arrows point to the well-developed DMS. Arrowheads to the F-actin rich peripheral zone. Scale bar represents 25 µm. (C) Live cell staining with SYTOX blue (cell permeability) and Calcein Green (enzymatic activity, viability) of cells in the BM and MK enriched fraction. Depicted is the fluorescent signal and the corresponding bright-field image of an overview and an image of higher magnification.
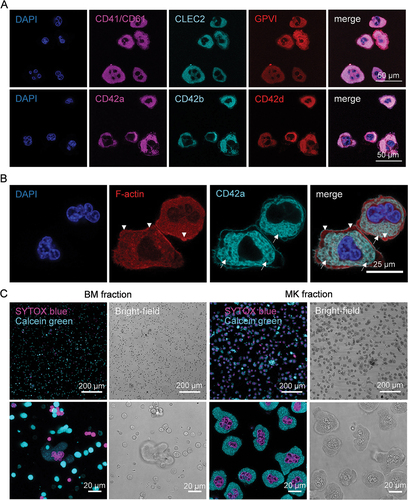
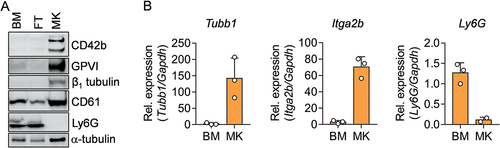
Figure 4. Analysis of MK specific and neutrophil specific proteins and mRNA in the BM, FT and MK fraction via immunoblot and qPCR. (A) Immunoblot of cell lysates from BM, FT and MK fractions and the expression of indicated proteins. -Tubulin serves as loading control. (B) qPCR from transcripts of the indicated genes in BM and MK fractions. mRNA levels were normalized to the endogenous control Gapdh.