Figures & data
Figure 1. Expression of core clock genes in Meg-01 cells and the effect of NMDAR hypo-function on their expression. Unmodified Meg-01 cells, Meg-01-GRIN1−/− cells, and Meg-01 cells treated with 100 µM MK-801 were serum starved for 18 h prior to re-feeding with serum-replete media. RNA lysates were collected every 4 h for 24 h with lysates for the 0-h time point collected immediately prior to re-feeding. Line graphs show relative expression of (A) positive arm (BMAL1, CLOCK, and NPAS2) and (B) negative arm (PER and CRY families) clock genes over 24 h relative to expression in unmodified Meg-01 cells at 0 h as examined by RT-qPCR. Data represent the mean ± SEM of three biological replicates per group. Statistically significant differences between groups (p < .01) were examined by two-way ANOVA for parametric data and by Friedman’s test for non-parametric data. NMDAR, N-methyl-D-aspartate receptor; RT-qPCR, quantitative reverse transcriptase-polymerase chain reaction.
Figure 2. Expression of auxiliary clock genes in Meg-01 cells and the effect of NMDAR hypo-function on their expression. Unmodified Meg-01 cells, Meg-01-GRIN1−/− cells, and Meg-01 cells treated with 100 µM MK-801 were serum starved for 18 h prior to re-feeding with serum-replete media. RNA lysates were collected every 4 h for 24 h; lysates for the 0-h time point were collected immediately prior to re-feeding. Line graphs show expression of (A) auxiliary loop genes (RORA and NR1D1) and (B) core clock gene regulators (TIM and CSNK1D) over 24 h relative to expression in unmodified Meg-01 cells at 0 h as examined by RT-qPCR. Data represent the mean ± SEM of three biological replicates per group. Statistically significant differences between groups (p < .01) were examined by two-way ANOVA for parametric data and by Friedman’s test for non-parametric data. NMDAR, N-methyl-D-aspartate receptor; RT-qPCR, quantitative reverse transcriptase-polymerase chain reaction.
Figure 3. Effect of BMAL1 overexpression on Meg-01 cell proliferation and viability. (A) Overexpression of BMAL1 was confirmed by RT-qPCR. Scatter plots showing (B) the relative number of viable cells measured by CyQUANT assay, (C) relative cell proliferation measured by BrdU incorporation assay, and (D) relative cell death measured by LDH release assay. Data points represent individual biological replicates. Statistical significant differences between groups (p < .05) were examined by Student’s t-test. RT-qPCR, quantitative reverse transcriptase-polymerase chain reaction; BrdU, 5-bromo-2-deoxyuridine; LDH, lactate dehydrogenase.
Figure 4. Effect of BMAL1 overexpression on the expression of cell cycle regulators in Meg-01 cells. Meg-01 cells transfected with a plasmid encoding either BMAL1 or GFP were serum starved for 18 h prior to re-feeding with serum-replete media. RNA lysates were collected every 4 h for 24 h; lysates for the 0-h timepoint were collected immediately prior to re-feeding. Line graphs show relative expression of (A) MYC, (B) WEE1, and (C) CDKN1A over 24 h relative to expression in GFP-transfected controls at 0 h as examined by RT-qPCR. (D) BMAL1 protein levels as measured by western blot in BMAL1-transfected Meg-01 cells compared to GFP transfected controls. Transfected cells were serum starved for 18 h prior to re-feeding with serum-replete media and cell lysates collected every 6 h for 24 h. Lysates for the 0-h time point were collected immediately prior to re-feeding. Representative western blot shown. Quantitative data represent the mean ± SEM of three biological replicates per group. Statistically significant differences between groups (p < .01) were examined by two-way ANOVA. RT-qPCR, quantitative reverse transcriptase-polymerase chain reaction.
Figure 5. Effect of BMAL1 knockdown on cell proliferation and viability in Meg-01-GRIN1−/− and unmodified Meg-01 cells. (A) knockdown of BMAL1 in Meg-01-GRIN1−/− was confirmed by RT-qPCR. Scatter plots showing (B) the relative number of viable cells measured by CyQUANT assay, (C, E) relative cell proliferation measured by BrdU incorporation assay, and (D, F) relative cell death measured by LDH release assay. Data points represent individual biological replicates. Statistical significant differences between groups (p < .05) were examined by Student’s t-test. RT-qPCR, quantitative reverse transcriptase-polymerase chain reaction; BrdU, 5-bromo-2-deoxyuridine; LDH, lactate dehydrogenase.
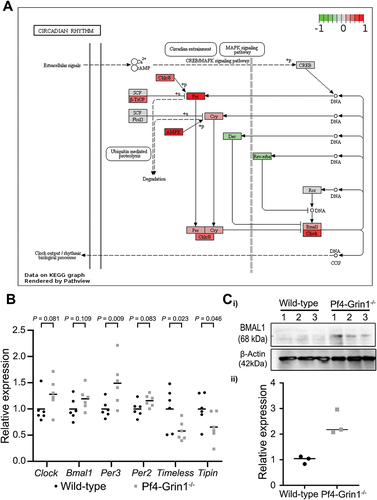
Figure 6. Megakaryocyte-directed deletion of Grin1 disrupts clock gene expression in mouse megakaryocytes. (A) scatterplot showing relative transcript levels of select clock genes detected using clariom S pico microarray in Pf4-Grin1–/– megakaryocytes calculated relative to the mean of wild-type megakaryocytes (n = 6 for each). Statistical enrichment was determined by ANOVA with post-hoc analysis using an empirical Bayes model.Citation27 (B) schematics showing transcriptional changes affecting the circadian rhythm pathway (mmu04070) in Pf4-Grin1–/– megakaryocytes relative to wild-type megakaryocytes mapped using the R package pathview. Upregulated molecules are shown in red, downregulated in green, and genes not mapped from our dataset are in gray. Gene abbreviations: AMPK, Prkab1 (protein kinase AMP-activated non-catalytic subunit beta 1), Prkab2 (protein kinase AMP-activated non-catalytic subunit beta 2), Prkag1 (protein kinase AMP-activated non-catalytic subunit gamma 1), Prkag2 (protein kinase AMP-activated non-catalytic subunit gamma 2), Prkag3 (protein kinase AMP-activated non-catalytic subunit gamma 3), Prkaa1 (protein kinase AMP-activated catalytic subunit alpha 1), and Prkaa2 (protein kinase AMP-activated catalytic subunit alpha 2); Bmal1, Arntl (aryl hydrocarbon receptor nuclear translocator-like protein 1); Ck1ε/δ, Csnk1e (casein kinase 1 epsilon), and Csnk1d (casein kinase 1 delta); clock, clock (clock circadian regulator) & Npas2 (neuronal PAS domain protein 2); CREB, Creb1 (cAMP responsive element binding protein 1); Cry, Cry1 (cryptochrome circadian regulator 1) and Cry2 (cryptochrome circadian regulator 2); Dec, Bhlhe40 (basic helix-loop-helix family member E40), and Bhlhe41 (basic helix-loop-helix family member E41); Fbxl3, Fbxl3 (F-box and leucine rich repeat protein 3z); rev-erbα , Nr1d1 (nuclear receptor subfamily 1 group D member 1); Per, Per1 (period circadian regulator 1), Per2 (period circadian regulator 2), and Per3 (period circadian regulator 3); Ror, Rora (RAR-related orphan receptor (a), Rorb (RAR-related orphan receptor (b), Rorc (RAR-related orphan receptor (c); SCF, Skp1a (S-phase kinase-associated protein 1), Cul1 (Cullin 1), and Rbx1 (RING-box protein 1); β-TrCP, Btrc (beta-transducin repeat containing E3 ubiquitin protein ligase), and Fbxw11 (F-box and WD repeat domain containing 11). (C) BMAL1 protein levels (mean ± SEM) as measured by western blotting in Pf4-Grin1–/– megakaryocytes compared to wild type (n = 3). Statistically significant differences in BMAL1 protein levels between WT and Pf4-Grin1–/– megakaryocytes (p < .05) were examined by unpaired t-test.