Figures & data
Figure 1. Schematic layout of the methodological protocol. PRP was obtained by centrifugation at 580 x g for 8 minutes. The lower half of the plasma layer was transferred to a new tube to obtain PRP. One part was directly preserved at either −20ºC or −80ºC for 1 or 3 months. The other part was first activated by CaCl2 addition and once the clot was formed, the supernatant, also called platelet lysate (PL), was preserved under the same conditions. Finally, frozen PRP and PL were characterized and in vitro evaluated using fresh samples as a control.
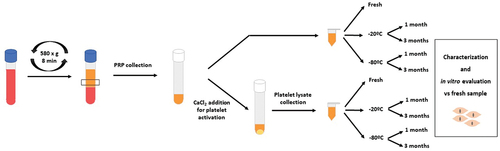
Table I. Summary of PRP characteristics.
Figure 2. Platelet concentration, size and activation after freezing preservation. Mean values of platelet concentration (A), size (B) and activation (C) in the PRP and PL according to different storage temperatures (−20/−80ºC) and time (Fresh, 1 month, 3 months). The platelet activation graph represents the CD62 and CD41 positive cells, relative to the fresh control. Error bars = standard deviation.
Figure 3. Platelet growth factors levels. Mean values of platelet growth factors concentration (A/D = PDGF, B/E = TGFB, C/F = VEGF) in the PRP according to activation time (A/B/C = before freezing, D/E/F = after thawing), storage temperatures (−20/–80ºC) and storage time (Fresh, 1 month, 3 months). Error bars = standard deviation. * p < .05; **** p < .0001.
Figure 4. Extra-platelet growth factors levels. Mean values of extra-platelet growth factors concentration (A / C = IGF-1, B / D = HGF) in the PRP according to activation time (A / B = before freezing, C / D = after thawing), storage temperatures (−20/−80ºC) and storage time (Fresh, 1 month, 3 months). Error bars = standard deviation. * p < .05; **** p < .0001.
Figure 5. Growth curves of dermal fibroblasts. Normal human dermal fibroblasts were cultured with a medium supplemented with either fresh or frozen platelet lysate in triplicate, and cell viability was measured every 24 hours. A = platelet lysate obtained before freezing; B = platelet lysate obtained after thawing. Error bars = standard deviation.
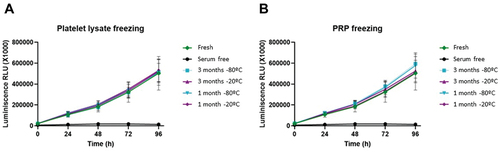
Figure 6. Fibrinogen levels and clot properties of the PRP after freezing. Mean values of fibrinogen levels (A), Young’s modulus (B) and dissipated energy (C) of the fibrin clot according to different storage temperatures (−20/−80ºC) and time (Fresh, 1 month, 3 months). Error bars = standard deviation.