
Figures & data
Table I. Baseline characteristics of all study participants. Data are mean (SD) and n (%). Glioblastoma multiforme volume was calculated by using the simplified formula for volume of an ellipsoid v = abc/2. KPS, Karnofsky performance score; *tumor involving total or preferably this cerebral lobe. Bonferroni correction for multiple comparisons was used and statistical significance was set at p < .01.
Figure 1. Time course of coagulation tests at baseline (time 0, T0), 2 (T2), 24 (T24), and 48-hour (T48) after surgery. Changes over time are plotted in patients undergoing glioblastoma multiforme resection (GBR, red lines), colon cancer resection (CCR, blue lines), and healthy blood donors (HBD, black bold line, T0). Inter-subject significant differences (p < .01, open brackets up) between both groups of patients or between patients and health blood donors, and intra-subject significant differences (p < .01, open brackets down) observed in each period in both groups of patients with respect to its baseline value, are shown. Graphs represent mean ± standard deviation. (a). Prothrombin time (s); (b). activated partial thromboplastin time aPTT (s); (c). Fibrinogen Clauss (g/L); (d). Factor XIII (%).
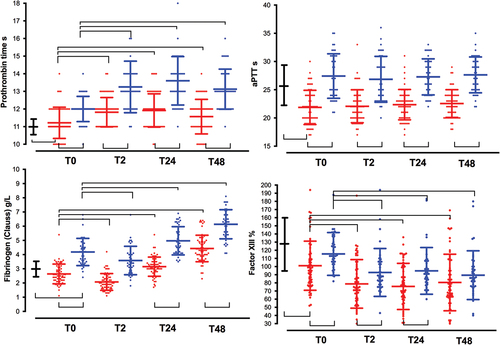
Figure 2. Time course of platelets count, von willebrand factor, and D-dimmers. See captions in . (a). Platelet count (x109/L); (b). von Willebrand factor (IU. dL−1); (c). D-dimers (ng.mL−1); (d). C-reactive protein (mg. L−1).
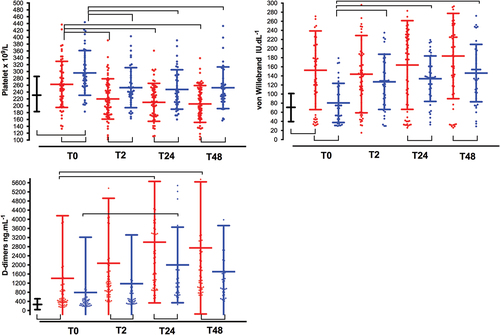
Figure 3. Time-course of ROTEM parameters. See captions in . (a). Clotting time in EXTEM (CT-EXTEM, s); (b). maximum clotting firmness in EXTEM (MCF-EXTEM, mm); (c). FIBTEM (MCF-FIBTEM, mm); (d). maximum lysis in EXTEM (ML-EXTEM, %).
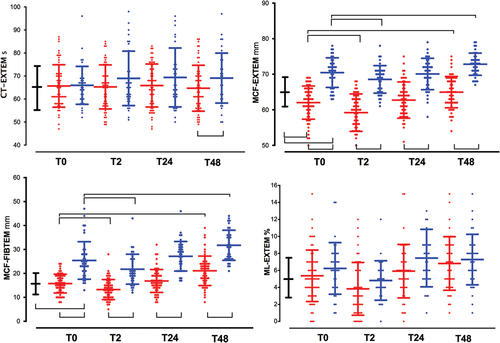
Figure 4. Time-course of platelet function tests. See captions in . The area under the aggregation curve (AUC) in response to stimulation with (a). arachidonic acid (AUC ARATEM, Ω·min); (b). adenosine diphosphate (AUC ADPTEM, Ω·min); (c). thrombin receptor-activating peptide-6 (AUC TRAPTEM, Ω·min); (d). the closure time in the PFA-200 collagen/epinephrine cartridge (Col Epi in s).
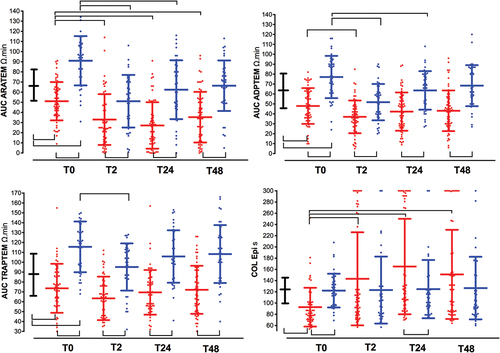
Table II. Surgical variables and clinical outcomes. Data are showed as mean (SD), median [interquartile range] and n (%). GOS: Glasgow Outcome Scale.
Table III. Baseline (before surgery, T0) data of laboratory biochemistry, coagulation tests, rotational thromboelastometry (ROTEM), ROTEM platelet, and collagen/epinephrine (COL EPI, time closure, s) for patients with multiforme glioblastoma (N = 60 patients), colon cancer (N = 40 patients) and healthy blood donors (N = 40).
Table IV. Univariate analysis of risk factors assessed at baseline, associated with 1-year mortality and 1-year of unfavorable GOS (1–3) in patients with glioblastoma multiforme (N = 60). Hb: hemoglobin. See captions in . Data are expressed as mean (standard deviation) or number (%).
Table V. Logistic regression analyses for variables associated with 1-year mortality and 1-year unfavorable clinical outcome (GOS 1–3). Adjusted odd ratio and 95% intervals confidence [AOR (CI95%)] are shown. ROC with AUC (SE) analyses with optimum cutoffs values (Youden index) for variables associated with unfavorable clinical outcome in bivariate analysis, are also shown.