Figures & data
Figure 1. Glycogen Phosphorylase inhibitors block platelet-mediated clot contraction. (A) Washed mouse (C57bl6/J) platelets (75 μg protein/sample) were harvested in the morning, treated with CP316819 (50 μM) or CP91149 (62.5 μM) for 30 min, and either held as resting (R) or activated (A) with 0.1 U/mL thrombin for 30 min. Glycogen levels were measured using an assay kit (Cayman #700480) following the manufacturer’s instructions (n = 5). (B, C) Representative clot contraction curves. Lag time (D), average contraction velocity (E), extent of contraction (F), and area under the curve (AUC; G) (n = 4–5) were calculated as described in Prakhya et al.Citation15 the error bars are SEM; P ≤ .05: *; P ≤ .01: **; P ≤ .001: ***; P ≤ .0001: ****. Statistical significance was assessed as described in the methods.
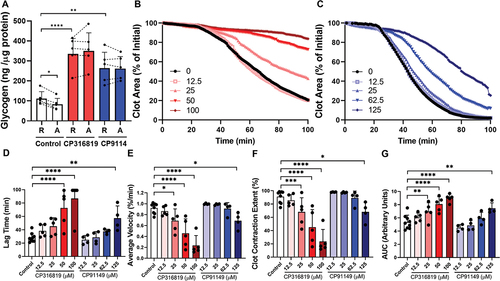
Figure 2. Disrupting glycogenolysis affects platelet secretion and integrin activation. Washed mouse (C57bl6/J) platelets were harvested in the morning and treated with CP316819 (50 μM) or CP91149 (62.5 μM) for 30 min at room temperature followed by the addition of indicated agonists (thrombin and collagen). Representative tracing showing thrombin- (0.05 U/mL; A) and collagen- (10 μg/mL; B) induced aggregation. (C) Summary data of the aggregation experiments (n = 3–5). Representative tracing showing thrombin- (0.05 U/mL; D) and collagen- (10 μg/mL; E) induced ATP secretion. (F) Summary data of the ATP secretion experiments (n = 3–5). (G) Flow cytometry measurements of P-selectin exposure in resting and thrombin-stimulated (0.05 U/mL) and convulxin (200 ng/mL) platelets (n = 4). (H) Flow cytometry measurements of αIIbβ3 integrin activation in resting and thrombin-stimulated (0.05 U/mL) and convulxin (200 ng/mL) platelets (n = 4). The error bars show SEM; P ≤ .05: *; P ≤ .001: ***; P ≤ .0001: ****. Statistical significance was assessed as described in the methods.
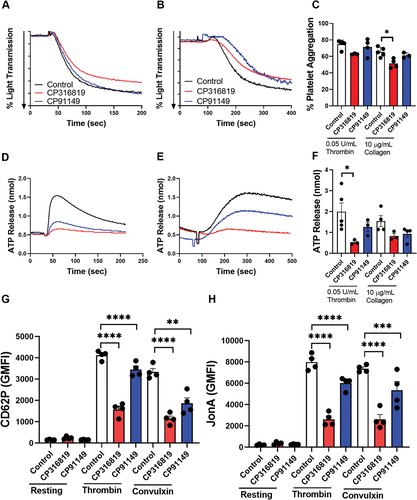
Figure 3. Glycogen phosphorylase inhibitors suppress thrombus formation under flow over immobilized collagen. (A) Representative DIC images, taken on a single plane, after 9 min of blood perfusion without inhibitor or in the presence of CP316819 (50 μM) or CP91149 (62.5 μM). Quantitative analysis of platelet surface area coverage (B), contraction score (from 0: no contraction to 3: fully contracted) (C), and multilayer score (from 0: no multilayer to 3: large fully multilayered thrombi). (D). Scale bar is 50 µm. The error bars show SEM; n = 3–6; P ≤ .05: *; P ≤ .01: **. Statistical significance was assessed as described in the methods.
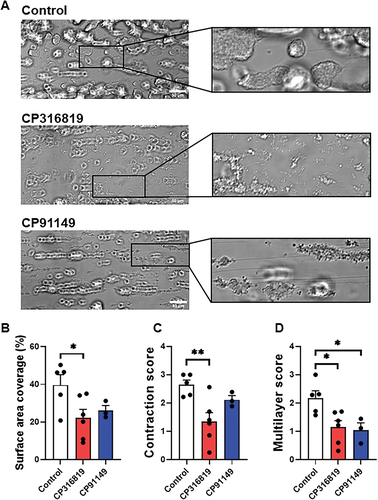
Figure 4. Glycogenolysis is more important when external glucose is limiting mouse (C57bl6/J) platelets (5 107 platelets/mL, harvested in the morning) were incubated with 50 μM CP316819 for 30 min in the presence of 0.5 mM CaCl2. Clot contraction was started by the simultaneous addition of 250 μg/mL fibrinogen and 0.02 U/mL thrombin. Shown are representative clot contraction curves where mouse platelets were isolated in buffers containing 2.5 (A), and 25 mM (B) glucose. Lag time (C), average contraction velocity (D), the extent of contraction (E), and area under the curve (AUC; F) (n = 3) were calculated as described in Prakhya et al.Citation15 the error bars are SEM; P ≤ .0001: ****. Statistical significance was assessed as described in the methods.
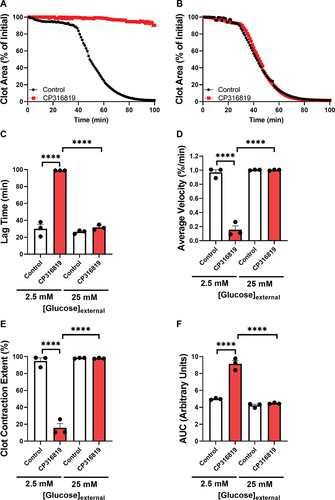
Figure 5. The effects of glycogenolysis inhibition are partially reversed with mitochondrial fuels mouse (C57bl6/J) platelets (5 107 platelets/mL, harvested in the morning) were incubated with different inhibitors as indicated for 30 min (50 μM CP316819, 10 mM 2DG and 5mM pyruvate) in the presence of 0.5 mM CaCl2. Clot contraction was started by the addition of 250 μg/mL fibrinogen and 0.02 U/mL thrombin. Shown are representative clot contraction curves for 2DG and pyruvate rescue (A) and pyruvate rescue with CP316819 (B). Lag time (C), average contraction velocity (D), extent of contraction (E), and area under the curve (AUC; F) (n = 3–6) were calculated as described in Prakhya et al.Citation15 the error bars are SEM; P ≤ .05: *; P ≤ .001: ***; P ≤ .0001: ****. Statistical significance was assessed as described in the methods.
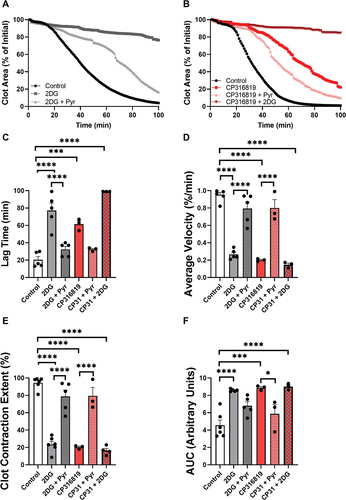
Figure 6. Inhibition of glycogenolysis affects aerobic glycolysis and oxygen consumption. Extracellular acidification rate (ECAR; A) and oxygen consumption (OCR: B) were measured using a Seahorse instrument (Agilent Seahorse XFe96, Santa Clara, CA) with the addition of substrates and inhibitors in resting and upon thrombin stimulation (0.1 U/mL) Extracellular acidification rate (ECAR) and oxygen consumption (OCR) were measured and calculated as described inCitation17 (n = 6). (B). the error bars are SEM; P ≤ .05: *; P ≤ .01: **; P ≤ .001: ***; P ≤ .0001: ****; Statistical significance was assessed as described in the methods.
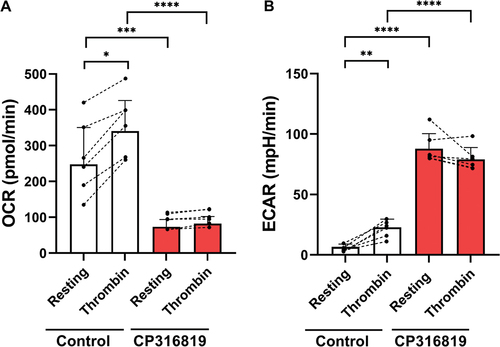
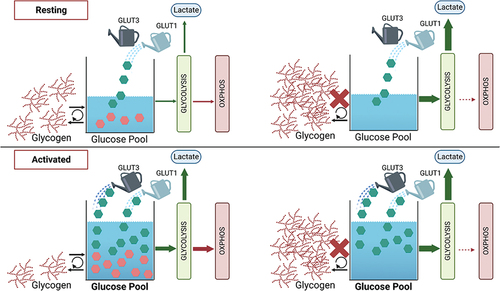
Figure 7. Model for glycogen and glucose metabolism in resting and activated platelets. Depicted is a working model to explain glycogen and glucose usage in resting and activated platelets. In resting platelets, an influx of glucose via GLUT1 fuels basal platelet bioenergetics and glycogen biosynthesis. The glycogen pools dynamically cycle (biosynthesis/degradation). When glycogen phosphorylase is inhibited (red X), glycogen accumulates and the bioenergetic balance shifts to aerobic glycolysis (high ECAR, low OCR). Upon activation with thrombin, glycogen stores are degraded plus additional glucose enters via GLUT3 from α-granules that mobilize to the platelet surface. This increases the flux of glucose through aerobic glycolysis, enhancing lactate production and shifting the bioenergetic balance. However, when glycogen phosphorylase is inhibited (red X), there is no additional activation-dependent increase in aerobic glycolysis or oxygen consumption. Our data suggest a biasing in the metabolic fates for the two pools of glucose, with that from glycogen being selectively directed to the TCA cycle and oxidation (OCR), while the extra-platelet glucose is channeled to lactate production (ECAR).