
Figures & data
Table I. Univariate analysis of PTR in patients.
Figure 1. Distribution of gene mutations.
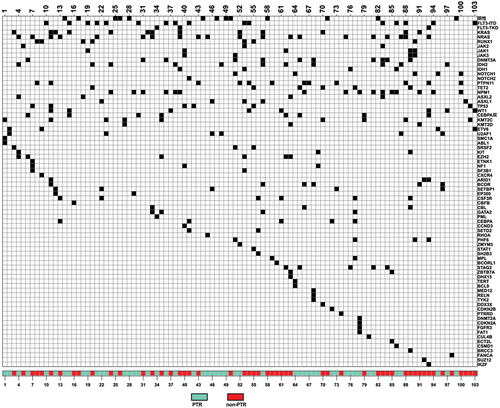
Figure 2. (a) Comparison of preliminary antibody screening values between the two groups. (b) Comparison of the frequency of HLA-I antibodies between the two groups. (c) Comparison of the frequency of HLA-II antibodies between the two groups. (d) Comparison of the number of patients with positive HLA-I and II antibodies between the two groups.
Table II. The distribution of antibodies in patients.
Table III. Multivariate logistic analysis.
Figure 3. (a) Kaplan–Meier curves for overall survival in the two groups. (b) Kaplan–Meier curves for relapse-free survival in the two groups.
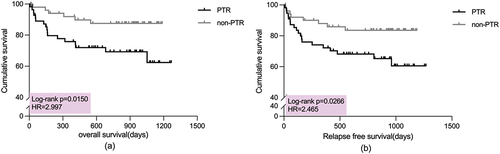
Figure 4. Comparison of platelet transfusion requirements during transplantation.
Figure 5. Trends in platelet levels after transplantation in the two groups.
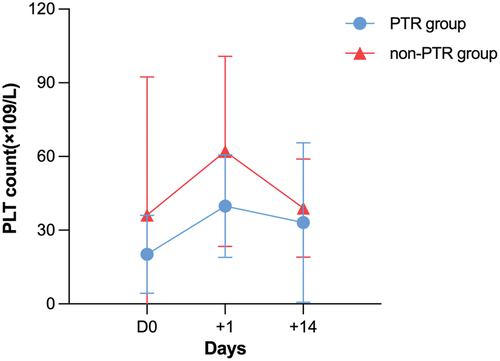
Figure 6. Multivariate COX regression analysis.
Supplemental Material
Download PDF (326 KB)Data availability statement
If requested, the original data presented in this paper will be available through the corresponding author [email protected].