
Figures & data
Figure 1. Overview of study design (adapted from Grech et al. 2021).
Whole blood was drawn from OMNI-2, Gen3, and NOS participants during Exam 3 (2016–2019). Whole blood and isolated PRP were used to take platelet activation measures using 5 different assays. Arterial tonometry measures were also gathered from these cohorts during Exam 3. Calcium measures were gathered from Gen3/OMNI-2 participants during Exam 2 (2008–2011), and CT vessel diameters were gathered from Gen3 participants during Exam 1 (2002–2005). A linear mixed effect model, which adjusted for age, sex, aspirin, and various CVD risk factors was used to assess the associations between the three main variable categories.Image sources:Arterial tonometry image: by Mikael Häggström, MD. Public Domain (CC0 1.0).Aortic and arterial calcium image: This Photo by Unknown Author is licensed under CC BY-SA.
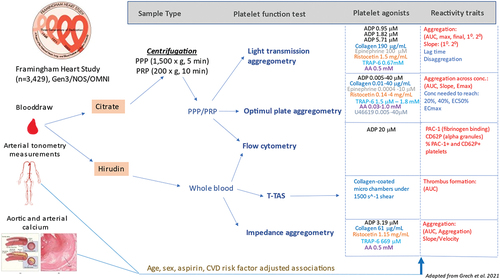
Table I. Demographic information.
Figure 2. Heatmap of Z statistics associating platelet activation, arterial calcium, tonometry, and diameter measures.
Red indicates increased platelet reactivity with an increase in the cardiovascular traits; blue indicates reduced platelet reactivity with a decrease in the cardiovascular traits. * (p ≤ .05); ** (p ≤ .01). We used linear mixed effects models, which included CVD risk factors, to calculate the betas (β) and standard errors (SE) for this display. Calcium values had 1 added and were ln-transformed. Following this transformation, the β and SE values were used to calculate z-statistics (β/SE). The following z-statistic values were multiplied by -1 to accurately depict the platelet activation directionality: Agg20, Agg40, ecMax, EC50, disaggregation traits (4 total), and lag time traits (2 total).Abbreviations: AAo: antero-posterior diameter of the ascending thoracic aorta obtained at the level of the right pulmonary artery; AAS: abdominal aorta calcium score; AbAo: antero-posterior diameter of the abdominal aorta 5 cm above the aorto-common iliac bifurcation; CAC: coronary artery calcium score; CPP: central pulse pressure; DAo: Antero-posterior diameter of the descending thoracic aorta obtained at the level of the right pulmonary artery; niCFPWV: negative inverse carotid femoral pulse wave velocity; TAC: thoracic aortic calcium score; Zc: characteristic impedance of the aorta.
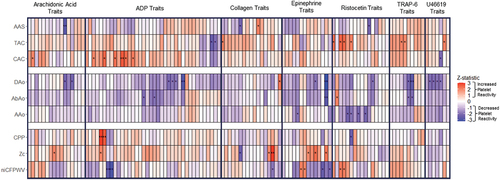
Table II. Aortic and arterial calcium results (risk factor-adjusted model).
Table IV. Arterial tonometry analysis results (risk factor-adjusted model).
Table III. Vessel diameter results (risk factor-adjusted model).
Supplemental material
Supplemental Material
Download TIFF Image (111.3 KB)Supplemental Material
Download MS Excel (127.4 KB)Supplemental Material
Download TIFF Image (41.2 KB)Data availability statement
Framingham Heart Study variables are deposited in the NIH dbGaP repository under the accession # phs000007.v32.p13 and available for application to access by qualified researchers https://www.ncbi.nlm.nih.gov/gap/.