Figures & data
Table I. Demographics and relevant clinical parameters for COVID-19 patients and Control blood donors.
Figure 1. FIB-SEM raw images and 3D surface rendered models of platelets from Control and COVID-19 patients. x-y orthoslices and 3D surface renderings of 17 platelets from each of 3 Control and 3 COVID-19 patients are shown. Scale bars (2 µm) as shown.
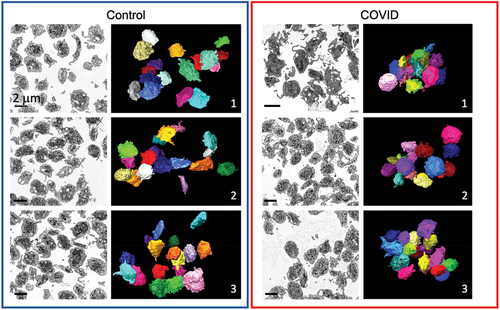
Figure 2. Organelle morphology in platelets from Control and COVID-19 patients. Images with two different magnifications are shown of platelets from a Control (Control donor 3, left) and a COVID-19 patient (COVID 2, right). Identified features are indicated: mitochondria (MIT), α-granules (AG), open canalicular system (OCS), dense tubular system (DTS), possible neutrophil extracellular traps (NETS?), and apoptotic bodies (apoptosis).
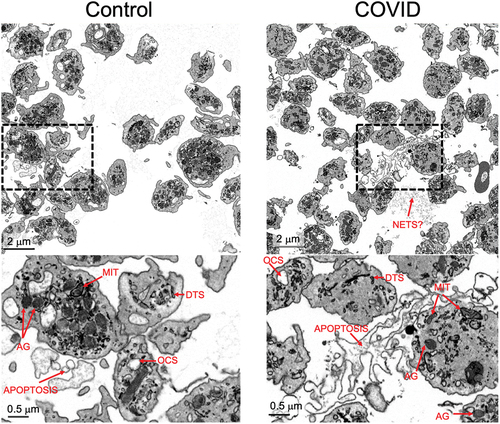
Figure 3. Platelet volume measurements from 3D deep learning segmented FIB-SEM images of platelets from Control and COVID-19 patients. (A) depicted is an example of how the cell membrane segmentation was performed. The left image is a representative x-y orthoslice, and the right shows the segmentation of the platelet plasma membrane with the measured interior, highlighted in green. The long and short axis are indicated. Long (B) and short (C) axis lengths for each platelet were plotted (Control 1, n = 101; Control 2, n = 103; Control 3, n = 102; COVID-19 patient 1, n = 107; patient 2, n = 101; patient 3, n = 100). (D) the long-to-short axis ratios were calculated from the values in (B) and (C). For comparison, the ratios were calculated and plotted using published data from platelets that had been immediately fixed.Citation20 in aggregate, the COVID-19 axis ratios were significantly higher compared to controls (p = .001), but intra-patient comparisons showed no differences (p > .05) except when comparing COVID-19 patient 1 to patients 2 and 3 (p < .05). (E) platelet volumes (µm3) were also calculated and plotted for each platelet analyzed. Volumes for immediate fixed platelets were also calculated and plotted. In aggregate, the volumes of platelets from COVID-19 platelets were significantly lower than Control (p < .001). Intra-sample comparisons were significant when comparing the platelets from COVID-19 patient 3 with patient 1 and 2 (p < .05) and Control platelets from donor 2 with those from donor 1 and 3 (p < .05). Other comparisons were not significant. For (B-E) solid lines indicate averages, while dashed lines indicate average ± one standard deviation. (F) summary statistics for the measurements in (B-E). The average, standard deviation, and n for each subject were listed for long axis, short axis lengths, axis ratios and platelet volumes. For multiple group comparison Welch’s ANOVA was used and for the one-to-one comparisons Welch’s t-test was used. Note: * is for p < .05, ** is for p < .005, and *** is for p < .0005.
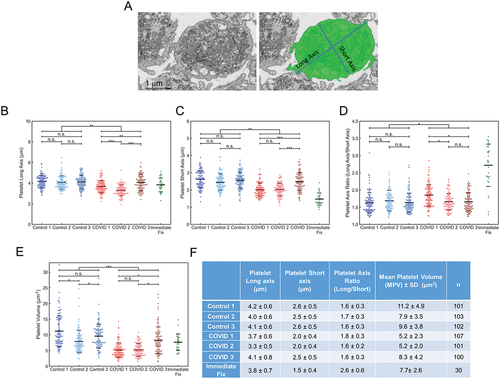
Figure 4. Deep learning and manual analysis of α-granules (AGs) in platelets from Control and COVID-19 patients. Analysis of platelets from all three Control samples and COVID-19 samples from patients 2 and 3 were done by deep learning segmentation. COVID-19 patient 1 platelets were analyzed by manual segmentation. (A) depicted is an example of how the platelet AG were analyzed. The left image is a representative x-y orthoslice, and the right shows the segmentation of the platelet AG, highlighted in blue. The number of AGs per platelet (B), AG volumes (C), and the ratios of total AG volume-to-platelet volume were calculated (D). The data for each platelet analyzed was plotted. In aggregate, platelets from COVID-19 patients had fewer AGs compared to controls (p = .022). Intra-sample comparisons showed no significant differences (p > .05) except when comparing COVID-19 patient 2’s platelets with those from COVID-19 patient 1 and 3 (p < .05). In aggregate, AG volumes in platelets from COVID-19 patients were significantly lower compared to Control (p = .001). Intra-sample comparisons showed no significant differences (p > .05) except when comparing Control 1 against Control 2 and 3 (p < .05). In aggregate, the total AG-to-platelet volume ratios were significantly higher in platelets from COVID-19 patients (p = .016). Intra-sample comparisons showed no significant differences (p > .05) except when comparing Control 1 against Control 2 and 3 (p < .05). In (B-D) solid lines indicate averages, while dashed lines indicate one standard deviation from average. (E) AG count, AG volume and total AG-to-platelet volume ratio with standard deviations, for each patient and donor are summarized. n is the number of platelets analyzed per sample. For multiple group comparison Welch’s ANOVA was used and for the one-to-one comparisons Welch’s t-test was used.
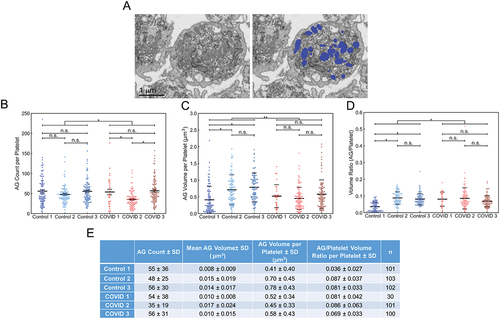
Table II. Comparative quantitative outcomes of COVID-19 patient platelet 3D ultrastructural analysis.
Figure 5. Manual segmentation analysis of mitochondria in platelets from Control and COVID-19 patients. (A) depicted is an example of how the platelet mitochondria were analyzed. The left image is a representative x-y orthoslice, and the right shows the segmentation of the platelet mitochondria, highlighted in magenta. The number of mitochondria per platelet (B), mitochondrial volumes (C), and the ratios of total mitochondrial volume to platelet volume were calculated (D). In aggregate, platelets from COVID-19 patients had similar numbers of mitochondria (p = .833). Intra-sample comparisons showed no significant differences (p > .05) except when comparing mitochondrial numbers from Control 1’s platelets with that from Control 2 and 3 (p < .05) and COVID-19 patient 1’s platelets with those from COVID-19 patient 2 and 3 (p < .05). In aggregate, platelets from COVID-19 patients had significantly lower total mitochondria volumes per platelet compared to Control (p = .038). Intra-sample comparisons showed no differences across all comparisons (p > .05). In aggregate, platelets from COVID-19 patients had significantly higher total mitochondria-to-platelet volume values compared to Control (p = .024). Intra-sample comparisons showed no differences across all comparisons (p > .05). In (B-D) solid black lines indicate sample averages, and the dashed lines indicate one standard deviation from average. (E) mitochondrial count, mitochondria volume and total mitochondria-to-platelet volume ratio with standard deviations, for each patient and donor are summarized. n is the number of platelets analyzed per sample. For multiple group comparison Welch’s ANOVA was used and for the one-to-one comparisons Welch’s t-test was used.
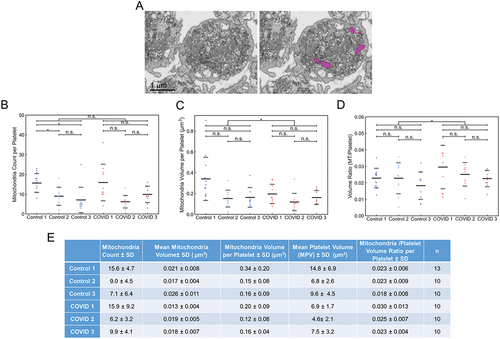
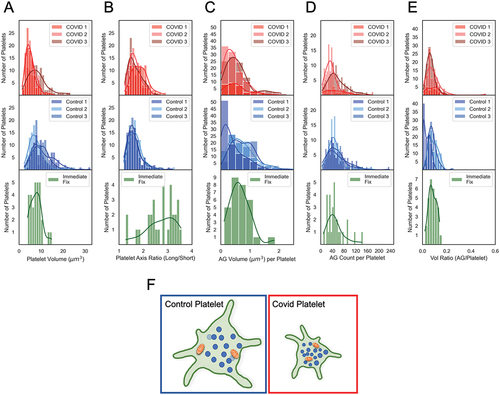
Figure 6. Comparative histogram analysis of platelet heterogeneity in COVID patient, Control and immediate-fixed samples (A-E). Histograms of platelet volumes, platelet axis ratios, AG counts, AG volumes and total AG-to-platelet volume ratios for platelets from COVID-19 patients (top row, red), from Control donor platelets (middle row, blue) and from immediate-fixed platelets (plotted from raw data in Pokrovskaya et al.Citation20; bottom row, green). (F) graphical depiction of the structural differences between platelets from control donors and COVID-19 patients. Statistical analysis reveals that the α-granule/mitochondrial-to-platelet volume ratio is significantly greater in COVID-19 patient platelets indicating a more densely packed and compact platelet. The COVID-19 patient platelets were 35% smaller, and most of the differences in organelle packing density were due to a decreased platelet size, and not due to organelle count or volume. The cartoon image is illustrative and not strictly to scale.