Figures & data
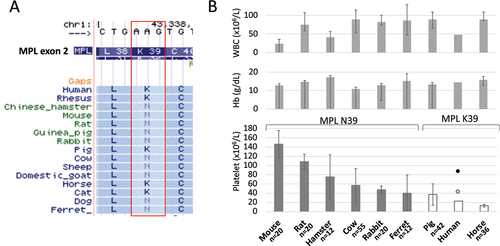
Figure 1. Comparison of human and mice MPL proteins.
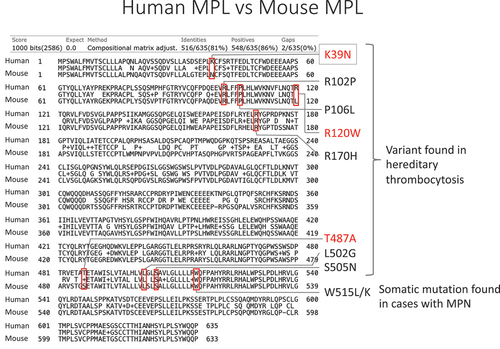
Figure 2. a) Vertebrate alignment track of UCSC genome browser (http://genome.Ucsc.edu/cgi-bin/hgGateway) showed the variation of MPL K/N39 among mammalian species. B) Comparison of blood counts in mammals. Species are sorted by the higher average platelet count from left to right. Compared to level of WBC and Hb, which are comparable among species, platelets showed a great diversity among species. Species with MPL N39 showed higher platelet counts than those in species with MPL K39. The error bar represents standard deviation. The filled circle indicates the mean platelet count of individuals with homozygous K39N. The blank circle indicates mean platelet count of individuals with heterozygous K39N. Mammalian blood count data were objected from Shiraishi J et al.Citation25 Mean platelet counts of individuals with MPL K39N were objected from Moliterno AR et al.Citation13