
Figures & data
Figure 1. Kappa-carrageenan (KCG) induces platelet activation in mice. (A) Washed murine platelets (200×103/µL) were stimulated with the indicated concentrations of KCG for 10 min using the LTA assay. Representative aggregation curves are shown. (B) Quantified maximum aggregation (%) (n = 8). Statistical significance was analyzed by one-way ANOVA with Dunnett’s multiple comparison test; ***P < .001, ****P < .0001, and not significant (ns). (C) Platelet aggregation stimulated with KCG (100 µg/mL) was evaluated in platelets once PFA-fixed or, pretreated with DMSO or tirofiban. The platelets were pre-incubated with 1% DMSO or 0.5 µM tirofiban for 5 min before stimulation. Murine platelets were fixed once with 0.1% PFA, and PFA was washed off, resuspended in modified Tyrode’s buffer to 200×103/µL and stimulated with KCG. (D) Quantified maximum aggregation (%) (n = 4). Statistical significance was analyzed by one-way ANOVA with Dunnett’s multiple comparison tests, where ****P < .0001. (E) Washed murine platelets (100×103/µL) were stimulated with saline, KCG (100 µg/mL), and thrombin (0.1 U/mL) followed by incubation with the anti-CD62P antibody for 1 h. The reactions were terminated with 0.1% PFA and analyzed by using flow cytometer. Representative histograms (n = 6) were created using the FlowJo software. (F) Quantified mean fluorescent intensity (MFI) of CD62P (n = 6). (G) The protocol was the same as (E), except the JON/A antibody was used. Representative histograms of JON/A binding are shown. (H) Quantified MFI of JON/A (n = 6). (I) Washed murine platelets (500×103/µL) were treated with saline, KCG (100 µg/mL), and thrombin (0.25 U/mL) for 30 min and then resuspended in Annexin binding buffer. After additional incubation with Annexin V-FITC, the FITC signal was measured by using flow cytometry immediately. Representative histograms of Annexin V binding are shown. (J) Summary data showing the percentage of Annexin V positive platelets (%) are presented (n = 4). Statistical significance was assessed by using a two-tailed, unpaired Student’s t-test; **P < .001.
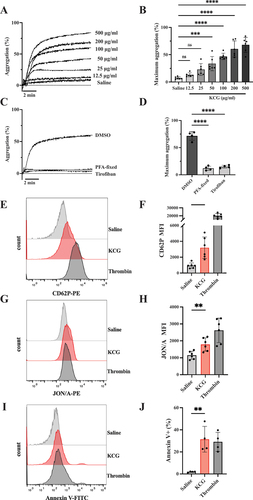
Figure 2. KCG activates murine platelets in a tyrosine-kinase-dependent manner (A) Washed murine platelets (200 × 103/µL) were pretreated with SFK inhibitor (SU6656) (20 µM) Syk inhibitor (CAS-622387) (20 µM), Gαq inhibitor (YM-254890) (0.4 µM), and TLR-4 inhibitor (TAK-242) (10 µM) for 5 min and then stimulated with KCG (100 µg/mL). All inhibitors were diluted in DMSO, and controls were tested with final DMSO concentrations ranging from 0.1–2%. Representative aggregation curves are shown. (B) Maximum aggregation data were quantified (n = 8), and the statistical significance was analyzed by using one-way ANOVA with Dunnett’s multiple comparison tests; ***P < .01, ****P < .0001, and not significant (ns). (C) Platelets were pre-incubated with 0.5% DMSO or Syk inhibitor (CAS-622387) (20 µM) for 5 min and then stimulated with KCG (100 µg/mL), PAR4-Ap (100 µM), and CRP (0.2 µg/mL). After incubation for 1 h at 37°C, JON/A binding was measured by using flow cytometry. Representative histograms are shown. (D) Mean fluorescence intensity (MFI) of JON/A was quantified (n = 6). (E) Platelets were pre-incubated with 0.2% DMSO or Gαq inhibitor (YM-254890) (0.4 µM) for 5 min and then stimulated with agonists for 1 h. Representative histograms are shown. (F) MFI of JON/A was quantified (n = 6). Data were statistically analyzed by using two-way ANOVA with the Dunnett’s test; ****P < .05; **P < .01; **P < .0001, and not significant (ns).
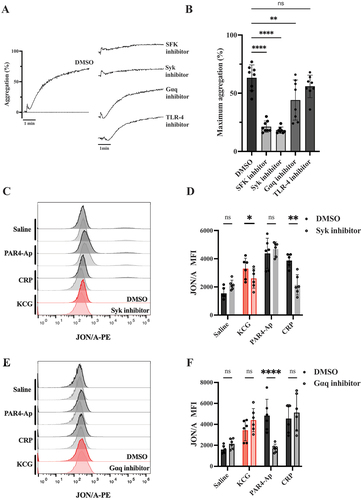
Figure 3. KCG induces intracellular tyrosine phosphorylation (A) Washed murine platelets (1000 × 103/µL) were stimulated with KCG (500 µg/mL), and the platelet reaction was stopped at the indicated second. The whole cell lysates were subjected to sodium dodecyl-sulfate polyacrylamide gel electrophoresis (SDS-PAGE) and western blotting with antibodies against anti-phosphotyrosine antibody (4G10), phosphorylated-Syk(Y526/526), total-Syk, phosphorylated-PLC (Y1217), total-PLCγ2, phosphorylated-LAT(Y191), and total-LAT. (B) This experiment was performed three times independently, and the signal intensity of specific phosphorylated tyrosine proteins was quantified using ImageJ software. One-way ANOVA statistically analyzed data (n = 3) with the Dunnett’s test; ***P < .05 with ****P < .01 and not significant (ns) (C) Washed murine platelets (1000 × 103/µL) were pre-incubated with Syk inhibitor (CAS-622387) (100 µM) or Gαq inhibitor (YM-254890) (2 µM) for 10 min. After KCG stimulation (500 µg/mL), the platelet reaction was terminated at 60 sec with LDS sample buffer. SDS-PAGE and western blotting conditions were performed as described above. The images are representative of three independent experiments. (D) The results of three experiments were quantified and statistically analyzed with one- way ANOVA with Dunnett’s tests; ****P < .01; **P < .001, and not significant (ns).
Figure 4. CLEC-2 is the essential receptor in KCG-induced platelet activation (A) Representative platelet aggregation curves are shown for platelets from Clec1bfl/fl mice and Clec1bfl/fl PF4-Cre mice, followed by KCG stimulation (100 µg/mL). (B) Quantified maximum aggregation stimulated with saline, KCG, CRP (0.2 µg/mL), PAR4-Ap (100 µM), and rhodocytin (10 nM) was quantified (n = 4). (C) Representative platelet aggregation curves are shown for murine platelets pre-incubated with control rat IgG or JAQ1 antibody (20 µM) for 10 min, followed by KCG (100 µg/mL) stimulation. (D) Quantified maximum aggregation stimulated with saline, KCG, CRP (0.2 µg/mL), PAR4-Ap (100 µM), and rhodocytin (10 nM) was quantified (n = 4). (E) Representative histograms showing Annexin-V FITC positive platelets are presented for murine platelets obtained from Clec1bfl/fl mice and Clec1bfl/fl Pf4-Cre mice. Platelet were stimulated with saline, rhodocytin (100 nM), thrombin (0.5 U/mL), and KCG (500 µg/mL) for 1 h at 37°C. (F) Quantitative information (n = 4). Statistical analysis was performed using two-way ANOVA with the Bonferroni test, and statistical significance is defined as ***P < .05, ****P < .01, ****P < .001, **P < .0001, and not significant (ns). (G) Washed platelets (500 × 103/µL) from Clec1bfl/fl mice and Clec1bfl/fl Pf4-Cre mice were stimulated with KCG (500 µg/mL), rhodocytin (100 nM), or CRP (2.0 µg/mL). The reaction was stopped after 60 sec, and platelet lysates were collected. The samples were subjected to western blotting using the indicated antibodies on the same membrane. A representative example of the data obtained from three independent experiments is shown. (H) Quantitative information from the three independent experiments and statistically analyzed with one-way ANOVA with Dunnett’s comparison tests, where **P < .001 and not significant (ns).
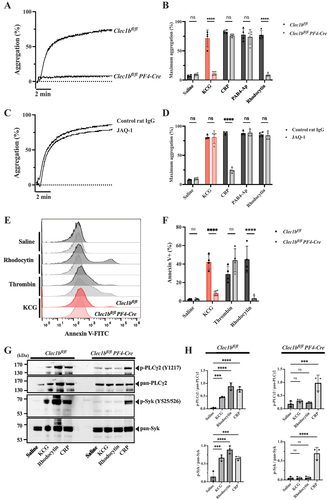
Figure 5. SPR analysis of KCG binding to mouse CLEC-2 (A) SPR data: sensorgrams were generated using a Biacore X system. Recombinant mouse CLEC-2-rFc and rabbit-Fc were immobilized via amine coupling on a CM5 sensor chip. KCG, diluted from 50 µg/mL to 1000 µg/mL in saline, served as the analyte in the solution phase. The resonance unit (RU) was plotted with rabbit-Fc as the reference, illustrating the binding to CLEC-2-rFc. (B) Rhodocytin, diluted from 25 µg/mL to 200 µg/mL, was used as an analyte to assess its binding RU to mCLEC-2 on the same sensor chip. (C) Mouse recombinant podoplanin, diluted from 25 µg/mL to 500 µg/mL, was evaluated as an analyte.
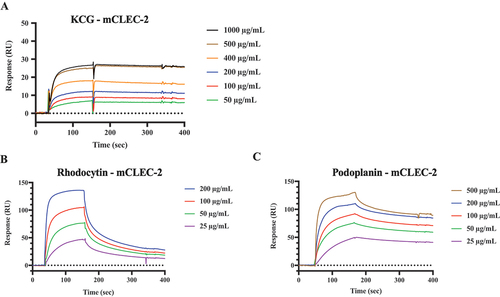
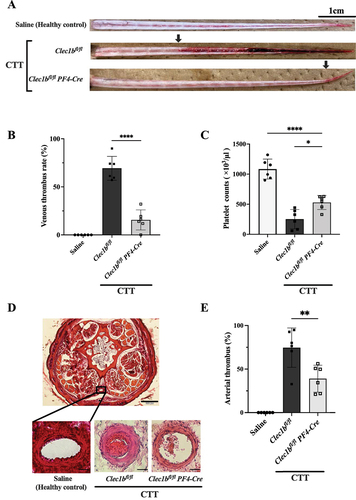
Figure 6. Platelet CLEC-2 deficiency inhibits KCG-induced tail thrombosis (A) Representative images of macrothrombus in the caudal vein 24 h after KCG administration, with the tail skin removed, are shown for healthy control, Clec1bfl/fl mice and Clec1bfl/fl Pf4-Cre mice. The arrowhead indicates the borders of the venous thrombus, scale bar = 1 cm. (B) quantification data of venous thrombus rate (%) with three groups (n = 6). Statistical significance was assessed by using a two-tailed, unpaired Student’s t-test; ***P < .0001. (C) thrombocytopenia was observed in the CTT groups 24 h after KCG administration. Data were analyzed by using one-way ANOVA with Dunnett’s multiple comparison tests; ****P < .05 and ****P < .0001. (D) microthrombus formation in the caudal artery was evaluated. Representative hematoxylin and eosin (HE)-stained tail tissues are shown for a section taken 3 cm from the tail. In the magnified view of healthy control mice, Clec1bfl/fl mice, and Clec1bfl/fl PF4-Cre mice. The upper magnified view scale bar represents 200 µm, while the lower arterial magnified view scale bar indicates 20 µm. (E) ImageJ software analyzed the tissue sections’ vessel lumen and thrombus area. The arterial thrombus filling ratio was quantified (n = 6). Statistical significance was assessed by using a two-tailed, unpaired Student’s t-test; **P < .01.
Supplemental Material
Download PDF (1.1 MB)Data availability statement
All data necessary to understand and assess the findings of this study are provided within the main text and Supplementary Figures.