
Figures & data
Figure 1. Flow field simulation analysis. (A) Wall shear distribution on different narrow models. (B) Shear rate variation history on the flow line through the narrow channel.
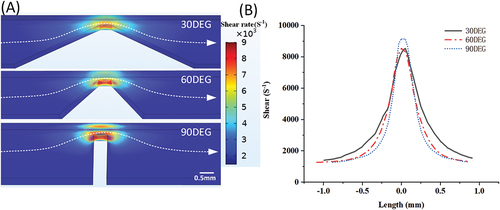
Figure 2. Platelet activation. (A) Scatterplot distribution of platelet activation. (B-C) P-selectin and activated GPIIb/IIIa expression statistics. Platelet activation was measured as a percentage of positive events. In the experiment, resting platelets and ADP-activated platelets were used as negative control and positive control respectively, and 30°, 60° and 90° respectively represented platelets induced by different SGCRs.All groups were compared with the 30° stenosis model. P < .05 means the difference is significant, * stands for P < .05, *** stands for P < .0005, **** stands for P < .00005. The microchannel was blocked with BSA before the blood sample was perfused.
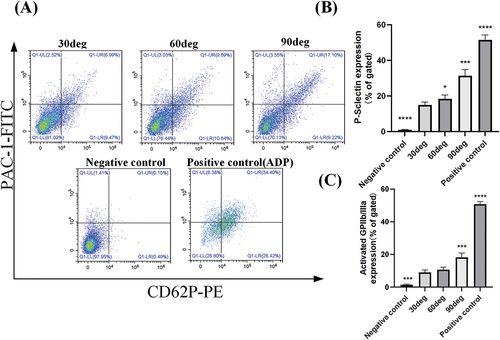
Figure 3. Monocyte-platelet aggregations(MPAs) formation. (A) Scatterplot distribution of MPAs. (B) Statistical analysis of MPAs formation. Platelet activation was measured as a percentage of positive events.All samples were compared with samples flowing through the 30° narrow microchannel. In the experiment, resting platelets and ADP-activated platelets were used as negative control and positive control respectively. P < .05 means the difference is significant, * stands for P < .05. The microchannel was blocked with BSA before the blood sample was perfused.
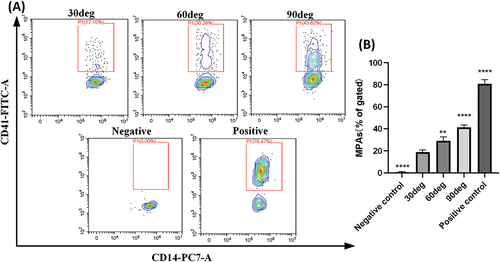
Figure 4. Morphological study of platelet aggregation. (A) Platelet aggregation downstream of different stenosis models. (B) Statistical analysis of aggregate area. The scale bar is in the lower left corner of the figure. P < .05 means the difference is significant, ** stands for P < .005, **** stands for P < .00005. The surface of the microchannel was covered with type I collagen fibers to provide the thrombus surface needed for platelet aggregation.
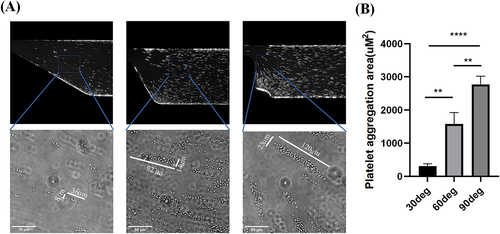
Figure 5. VWF:RCO test.(A) Representative vWF and platelet aggregation.(B) Results statistics. Resting platelets were used as negative control, and all samples were compared with 30° stenosis model. The double positive area in the upper right quadrant of the scatter plot represents the platelets that bind to vWF. P < .05 means the difference is significant, * stands for P < .05, ** stands for P < .005. The microchannel was blocked with BSA before the sample was perfused.
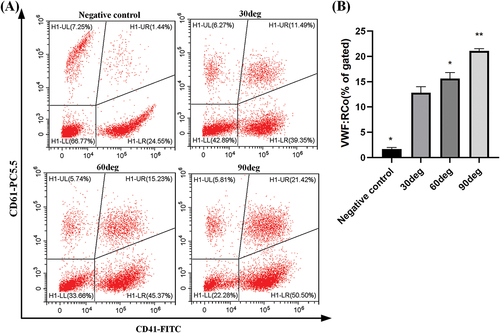
Figure 6. Western blotting results.(A) Expression of platelet P-Akt,Akt and GAPDK.(B) the relative expression of P-Akt. In the experiment, resting platelets were used as negative control, the expression of GAPDH was used to measure the sample loading between groups, and the relative expression of P-Akt was measured by P-Akt/Akt. P < .05 means the difference is significant, * stands for P < .05, *** stands for P < .0005. The microchannel was blocked with BSA before the sample was perfused.
Table I. Platelet counts (×109). Platelet count was detected by Uncorrected Fisher’s LSD test. All samples were compared with those perfused by the 30° stenosis model (30°), n = 3, P < .05 indicates a significant difference.
Supplemental Material
Download PDF (1.4 MB)Data availability statement
Please contact the corresponding author for detailed data.