
Figures & data
Table I. Demographics and procedures.
Figure 1. Bleeding risk and platelet counts for patients with and without 22q11.2DS. Orange denotes patients with the deletion and blue denotes patients without the deletion, cross-hatch denotes bleeding. Boxes demonstrate mean with min/max. (A) Overall incidence of bleeding (p = .86). (B) incidence of bleeding by STAT procedure risk category. (C) Platelet counts by surgical procedure.
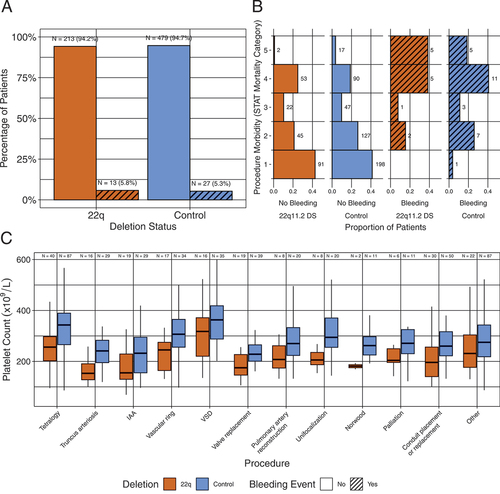
Figure 2. Platelet counts and volumes. Boxes show median and IQR, overlying circles represent individual patient data points. (A) Platelet counts by cohort. (B) Mean platelet volume by cohort. Bars show p values from two-way ANOVA with Tukey HSD correction for multiple comparisons.
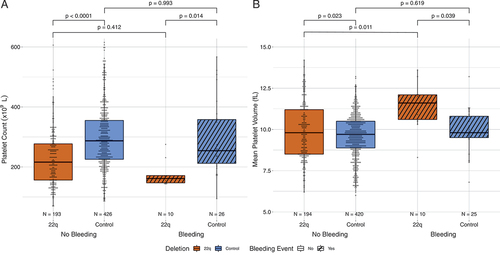
Table II. Risk of bleeding by surgical procedure.
Figure 3. Transfusion requirements. Orange denotes patients with the deletion and blue denotes patients without the deletion, cross-hatch denotes bleeding. (A) Histogram of PRBC transfusion events in the patient cohorts with and without bleeding. (B) Number of transfusion donor exposures. (C) Platelet transfusion volume in mL/kg. Bars show p values from pairwise Wilcoxon signed rank tests corrected for multiple comparisons.
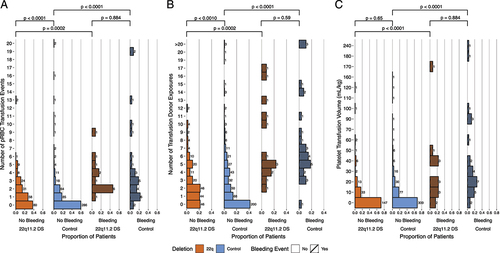
Figure 4. Additional factors influencing bleeding risk. Orange denotes patients with the deletion and blue denotes patients without the deletion, cross-hatch denotes bleeding. (A) Relationship of PTT (seconds) and bleeding. Bars show p values calculated by two-way ANOVA with Tukey HSD correction for multiple comparisons. (B) Number of patients with bleeding who received pre-operative anticoagulation or antiplatelet therapy was not different compared to those without bleeding (p = .213, chi-squared test).
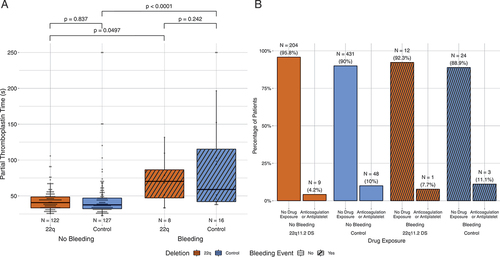
Figure 5. Multivariate analysis of factors influencing bleeding in patients undergoing cardiac surgery. Dotted line represents neutral. Diamond represents odds ratio (OR) with line representing 95% confidence interval.
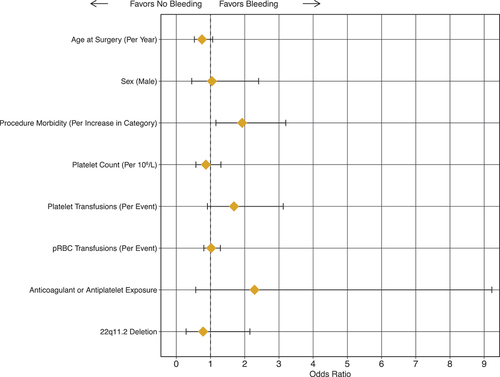
Table III. Multivariate analysis.