
Figures & data
Figure 1. Timeline for treatments, blood draws, surgery, and euthanasia. Antisense oligonucleotide treatment against thrombopoietin (THPO-ASO, blue triangle) and saline (red circle) were administered once a week to decrease or control for platelet count, respectively. A mimetic to thrombopoietin (TPO-mimetic, green triangle) was administered using oral gavage to mice 5 days a week and continued from surgery to euthanasia to maintain an elevated platelet count. Blood draws were analyzed weekly through complete blood count with differential. Separate cohorts of mice underwent euthanasia at post-operative day (POD) 3 and 7 to evaluate the effects of treatments on deep vein thrombus burden. Created with Biorender.com.
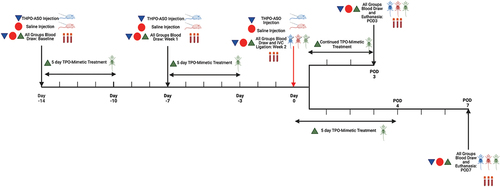
Figure 2. Platelet count. Percent change in platelet count from baseline to surgery as a result of THPO-ASO, saline, and TPO-mimetic treatment. (N = 12 per treatment group, *** indicates p < .001, and **** indicates p < .0001, ANOVA with Tukey post-hoc).
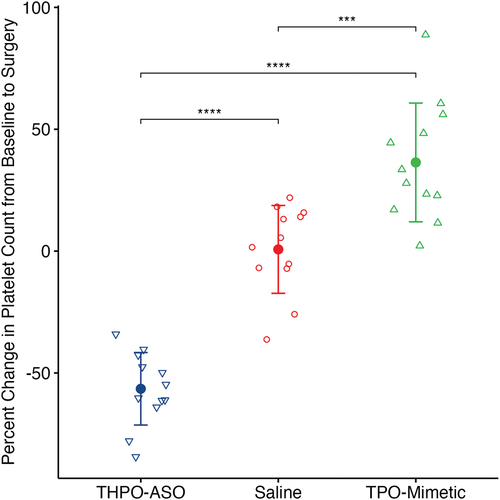
Figure 3. DVT outcomes. Thrombus weights were measured to determine thrombus burden at post-operative day (POD) 3 and 7 (*indicated p < .05, ** p < .01, ANOVA with Tukey post-hoc).
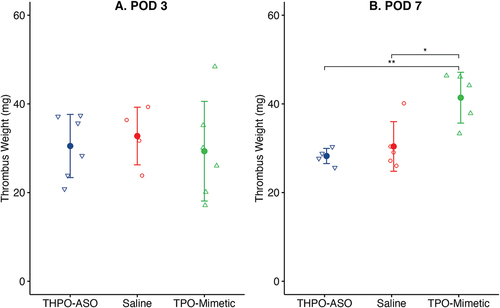
Figure 4. Immunohistochemistry of thrombi. A–C. Trichrome staining for collagen and thrombus organization. D–F. CD31 staining for endothelial cells and channel formation indicative of neovascularization. G–I. Smooth muscle actin (SMA) staining for smooth muscle cells (** p < .01, Kruskal–Wallis with Dunn’s post-hoc). A star indicates the location of the thrombus, a diamond indicates the location of the vein wall, and an arrow identifies areas of positive staining.
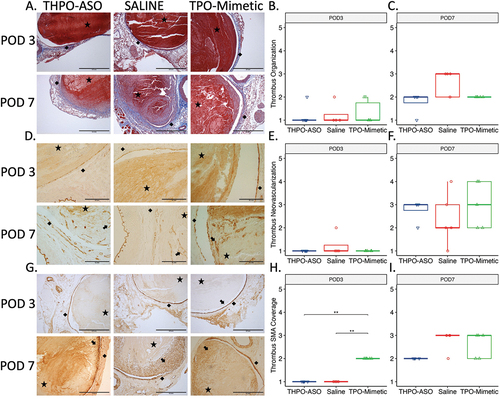
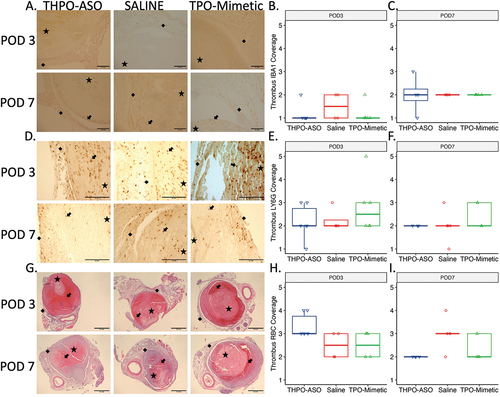
Figure 5. Immunohistochemistry of thrombi. A–C. IBA1 staining for macrophages D–F. LY6G staining for neutrophils. G–I. H&E staining for erythrocyte, platelet, and plasma protein/fibrin content. A star indicates the location of the thrombus, a diamond indicates the location of the vein wall, and an arrow identifies areas of positive staining.
Supplementary Material
Download PDF (417.3 KB)Data availability statement
Data generated for this study are available through request to the corresponding authors.