261
Views
0
CrossRef citations to date
0
Altmetric
Letter

Identification of apolipoprotein A-I as a target of platelet tyrosine kinases

, , &
Article: 2290921 | Received 23 Dec 2022, Accepted 30 Nov 2023, Published online: 15 Dec 2023

Figures & data

Figure 1. Washed human platelets were stimulated as previously reported.Citation6 Samples were analyzed by immunoblotting using anti-phosphotyrosine antibodies (4G10). Loading controls were performed with antibodies recognizing RAN. Unstimulated platelets (c, resting) were incubated with sample buffer for 60 s. The index on the left represents molecular mass standards. A: washed platelets were stimulated with thrombin (0.1 U/ml; from Sigma, Munich, Germany) for the indicated times. The immunoblot shown is representative for three similar experiments. B: washed human platelets were stimulated with thrombin (0.1 U/ml) or collagen (3 µg/ml; from Nycomed, Ismaning, Germany) for 30 seconds. Samples were analyzed as described above and the tyrosine phosphorylation of p27 was densitometrically quantified. Results are given as mean ± S.D. of six similar experiments. Statistical analysis was performed by one-way ANOVA and post-hoc Tukey´s test. p-values were defined as p > .05 (ns; not significant).
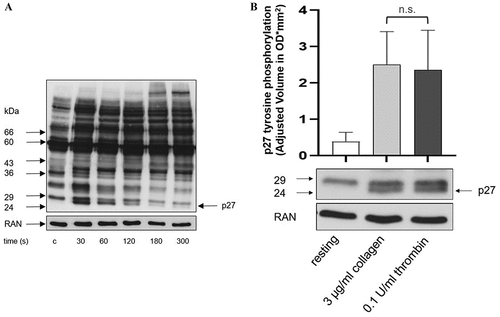
Figure 1. Washed human platelets were stimulated as previously reported.Citation6 Samples were analyzed by immunoblotting using anti-phosphotyrosine antibodies (4G10). Loading controls were performed with antibodies recognizing RAN. Unstimulated platelets (c, resting) were incubated with sample buffer for 60 s. The index on the left represents molecular mass standards. A: washed platelets were stimulated with thrombin (0.1 U/ml; from Sigma, Munich, Germany) for the indicated times. The immunoblot shown is representative for three similar experiments. B: washed human platelets were stimulated with thrombin (0.1 U/ml) or collagen (3 µg/ml; from Nycomed, Ismaning, Germany) for 30 seconds. Samples were analyzed as described above and the tyrosine phosphorylation of p27 was densitometrically quantified. Results are given as mean ± S.D. of six similar experiments. Statistical analysis was performed by one-way ANOVA and post-hoc Tukey´s test. p-values were defined as p > .05 (ns; not significant).

Figure 2. Washed human platelets (5 × 108/ml) were preincubated for 5 min with buffer, the negative control agent PP3 (10 µM; from Merck, Darmstadt, Germany) or various SFK-inhibitors (10 µM each, purchased from Sigma, Munich, Germany) prior to stimulation with thrombin (0.1 U/ml; left; from Sigma, Munich, Germany) or collagen (3 µg/ml; right; from Nycomed, Ismaning, Germany). Reactions were stopped after 30 s by addition of SDS-sample buffer. Samples were analyzed with anti-phosphotyrosine antibody (4G10). The tyrosine phosphorylation of p27 was densitometrically quantified.Citation6 There were no significant differences in p27 tyrosine phosphorylation under these conditions of stimulation (Figure 1B). Therefore, data were transformed by setting the intensity of phospho-protein band of the sample stimulated with thrombin or collagen alone as 100%. Results are given as mean ± S.D. of at least three similar experiments. Statistical analysis was performed by one-way ANOVA and post-hoc Dunnett´s test. p-values were defined as p > .05 (ns; not significant), p < .05 (*), p < .001 (***), p < .0001 (****).
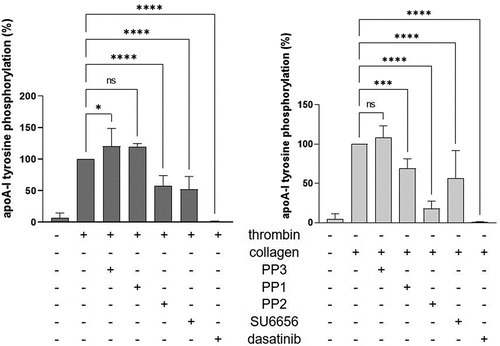
Figure 2. Washed human platelets (5 × 108/ml) were preincubated for 5 min with buffer, the negative control agent PP3 (10 µM; from Merck, Darmstadt, Germany) or various SFK-inhibitors (10 µM each, purchased from Sigma, Munich, Germany) prior to stimulation with thrombin (0.1 U/ml; left; from Sigma, Munich, Germany) or collagen (3 µg/ml; right; from Nycomed, Ismaning, Germany). Reactions were stopped after 30 s by addition of SDS-sample buffer. Samples were analyzed with anti-phosphotyrosine antibody (4G10). The tyrosine phosphorylation of p27 was densitometrically quantified.Citation6 There were no significant differences in p27 tyrosine phosphorylation under these conditions of stimulation (Figure 1B). Therefore, data were transformed by setting the intensity of phospho-protein band of the sample stimulated with thrombin or collagen alone as 100%. Results are given as mean ± S.D. of at least three similar experiments. Statistical analysis was performed by one-way ANOVA and post-hoc Dunnett´s test. p-values were defined as p > .05 (ns; not significant), p < .05 (*), p < .001 (***), p < .0001 (****).