
Figures & data
Figure 1. Schematics of the gravity sedimentation technique. Platelet (PLT) antisedimentation rate (PAR) is measured by comparing the platelet count in the upper and lower fractions of the blood column after 1 h of gravity sedimentation at room temperature. PAR (%) is calculated as (Upper − Lower)/(Upper + Lower) × 100.
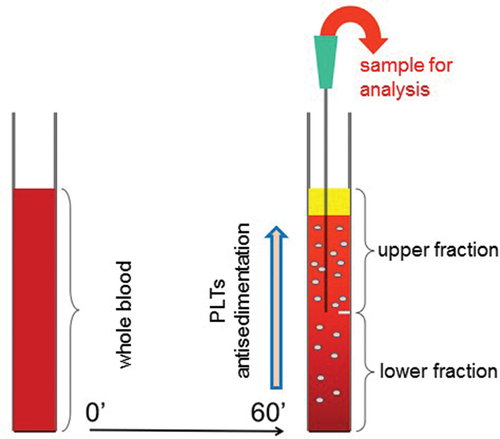
Table I. Bulk characteristics and aggregability of platelets after 1-h gravity sedimentation.
Figure 2. Platelet sedimentation kinetics and its association with ESR. Cell counts from three equal fractions (upper, middle, and lower respectively) of the sedimented blood which were separated at five different time points (30, 45 min, and 1, 2, 3 h). (A) Platelet count as a function of time in a subject with physiological ESR; (B) platelet count as a function of time in a subject with high ESR; (C) PAR as a function of we in a cohort of 21 subjects. The data were fit with a monoexponential function with a plateau value of 78.113 (±6.94 SD) and a decay constant of 5.0245 (±2.42 SD).
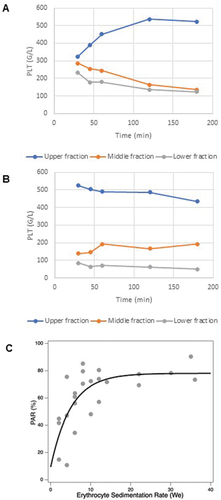
Figure 3. ADP-induced platelet aggregation. A–C depicts representative platelet aggregometry curves obtained on whole blood (A), the upper (B) and the lower (C) samples, to demonstrate the curve(s) of the bedside multiplate readings (all measurements provided in duplicate). Red and blue traces refer to two independent measurements. Vertical axis: AU stands for arbitrary unit. Horizontal axis: time (sec). Initial velocity (D) and area under the curve (AUC = arbitrary unit × time) (E) measured by whole blood impedance aggregometry in whole blood from healthy subjects (n = 21) and the upper and lower fractions separated after 1-h gravity sedimentation. Data are shown as median and 25th−75th percentiles (Wilcoxon signed rank test). The horizontal dotted lines mark the normal range of AUC given by the manufacturer.
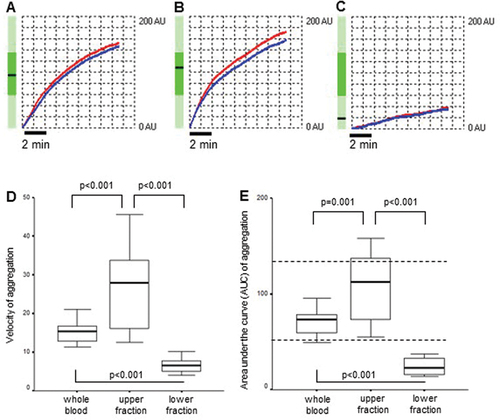
Figure 4. Electron microscopy of platelets. TEM images of platelets of healthy subjects from the lower (A and C) and upper (B and D) fractions. The arrow in C and the asterisk in D point at an alpha-granule and a dense granule, respectively.
Figure 5. Atomic force microscopy of platelets. Amplitude-contrast AFM images of mica-adsorbed washed platelets from the lower (A) and upper (B) fractions. Scale bar 2 µm. Insets show height-contrast AFM images of representative platelets. Scale bar 0.5 µm. Comparison of the volume (C) and central height (D) of the platelets from the different fractions.
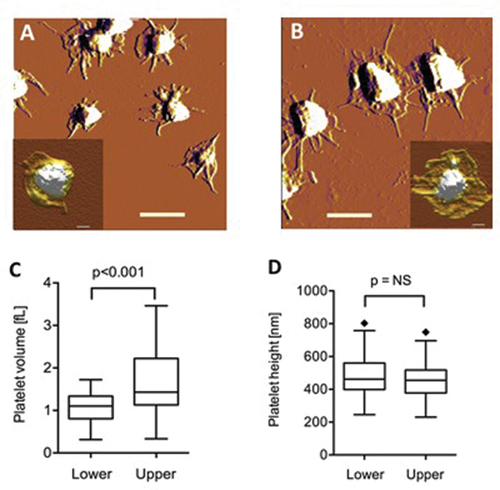
Table II. Transmission electron microscopy data of platelets after one-hour gravity sedimentation.
Supplementary Material
Download PDF (597.5 KB)Data availability statement
The data presented in this study are available on request from the corresponding author.