
Figures & data
Figure 1. Quantitative and qualitative assessment of TCF3 expression in megakaryocytes of MPN (ET/PV = 68, MF = 34) and control bone marrow trephines (n = 71). (A–E) Immunohistochemical staining showing TCF3 in bone marrow trephines of normal marrow and MPN subtypes. Black arrows indicate examples of TCF3-positive and white arrows TCF3-negative megakaryocytes. Positive erythroid, granulocyte and lymphoid cells are present in all cases. A) control bone marrow (x600); B) ET (x600); C) PV (x600); D) MF with distorted TCF3-negative megakaryocytes adjacent to trabecular bone (x400); E) MF that arose secondary to preceding ET. The interstitial megakaryocytes are positive and have a morphological appearance as seen in B). The TCF3-negative megakaryocytes are angulated with pyknotic nuclear chromatin, a feature of MF (x400). (DAB substrate; hematoxylin counterstain.) F) percentage of megakaryocytes expressing TCF3 in control, ET/PV and MF patients (Kruskal–Wallis one-way ANOVA analysis followed by Benjamini–Hochberg adjustment). Data shown as the mean ±95% confidence interval. *padj < 0.05, **padj < 0.01, ***padj < 0.001, ****padj < 0.0001.
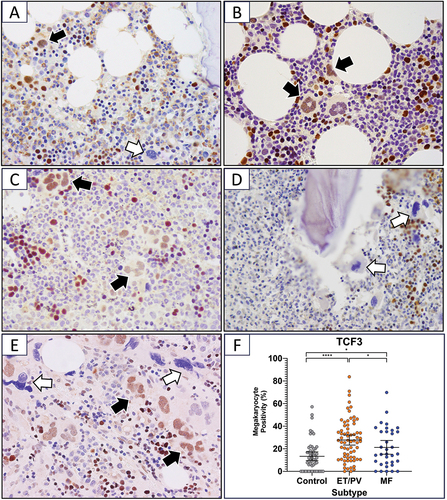
Figure 2. Normalized counts of A) TCF3 and direct targets B) CDKN1A, C) GFI1B and D) AURKA in control (n = 10), ET/PV (n = 48) and MF (n = 26) patients. Normalized counts were analyzed using a one-way ANOVA followed by Benjamini–Hochberg adjustment. Data shown as mean ± 95% confidence interval. *padj < 0.05, **padj < 0.01, ***padj < 0.001, ****padj < 0.0001.
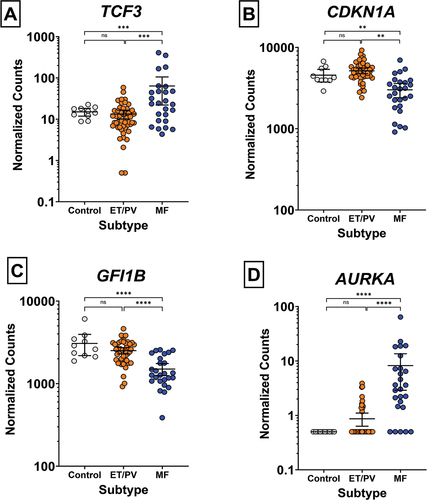
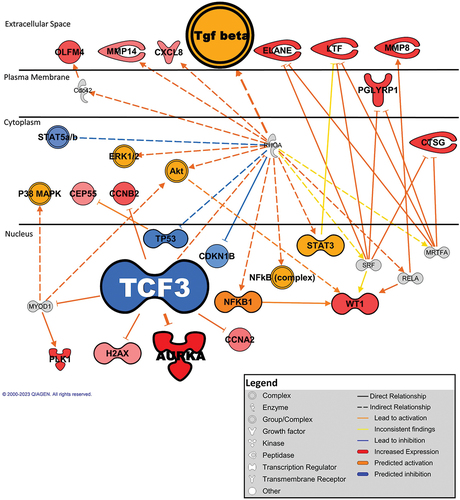
Figure 3. Genes involved in the downstream effects of TCF3 inhibition. Network activation and inhibition was stratified to a z-score below −2 and above 2. Networks fulfilling the “bias” criteria were excluded. Minimum network-bias-corrected p-value of 10−4. Genes in orange are predicted to be activated and in blue are predicted to be inhibited. Red indicates genes that have increased transcript expression in platelets from patients with ET/PV (n = 48) and MF (n = 26) patients.
Data availability statement
The data that support the findings of this study are available from the corresponding author upon reasonable request.