Figures & data
Figure 1. The effects of rhCEACAM1 and A1 domain of CEACAM1-derived peptides on collagen-induced platelet aggregation. (a) Platelet aggregation induced by various agonists. The results are expressed as mean ± SEM (n = 3). *p < .05, **p < .01, vs. The vehicle group. (b, c) Platelet aggregation after treatment with various peptides and collagen stimulation. The rate of aggregation was recorded at the end of 10 min. The results are expressed as mean ± SEM (n = 4–6). *p < .05, **p < .01, ****p < .0001, vs. The vehicle group.
Figure 2. The effects of QDTT on various agonists-induced platelet aggregations and its cytotoxicity. (a-j) Platelet aggregation after treatment with QDTT and activation with various agonists. The results are presented as mean ± SEM (n = 4–6). *p < .05, **p < .01, ***p < .001, ****p < .0001, vs. The vehicle group. (k) LDH assay after QDTT treatment. The results were presented as mean ± SEM (n = 3). ns: not significant versus each group. (i) Platelet adhesion after QDTT treatment. The results are expressed as mean ± SEM (n = 4). **p < .01, ****p < .0001 vs. The vehicle group.
Figure 3. Effects of QDTT on convulxin-induced platelet secretion. Histogram (a) and a bar graph (b) present the effects of QDTT on platelet membrane P-selectin expression after convulxin stimulation, as assessed by flow cytometry using phycoerythrin (PE)-conjugated anti-CD62P monoclonal antibody. (c) Bar graph presents the effects of QDTT on convulxin-induced ATP release. The results were expressed as mean ± SEM (n = 3). *p < .05, ***p < .001, and ****p < .0001 vs. The vehicle group.
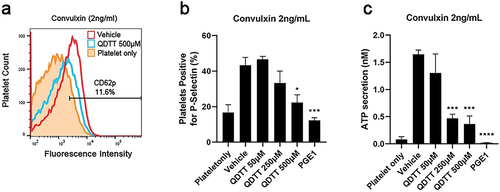
Figure 4. Effects of QDTT on GP IIb/IIIa-mediated human platelet “inside-out” activation. Histogram (a) and a bar graph (b, c) present the effects of QDTT on platelet membrane PAC-1 expression after agonist stimulation (c). (d) Line graph representing the effect of QDTT on convulxin-induced calcium ion release in real-time. (e and f) the bar graph represents the percentage of peak RFU at different concentrations of QDTT compared with the vehicle group. The results are presented as mean ± SEM (n = 3–4). *p < .05, **p < .01, ***p < .001, and ****p < .0001 vs. The vehicle group.
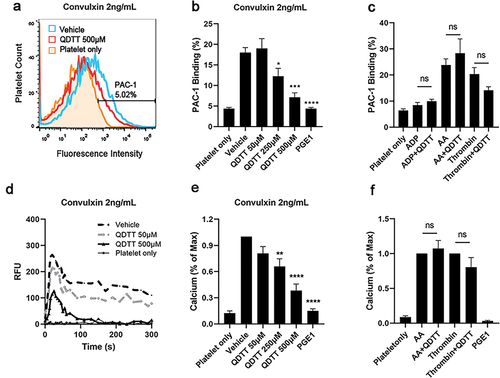
Figure 5. Effects of QDTT on GPVI-mediated platelet signal transduction. (a, b) After incubation with QDTT, 2 ng/mL convulxin was added to stimulate washed human platelets while stirred at 1,200 rpm. In order to block feedback from ADP and thromboxane during convulxin-medicated GPVI activation, we added apyrase (1 U/mL), indomethacin (10 μM), and integrin (20 μg/mL) before stimulation of platelets by convulxin at 37°C (c, d). The results are presented as mean ± SEM (n = 3). *p < .05 and **p < .01 vs. The vehicle group. (e, f) After incubation with QDTT, PI3K inhibitor wortmannin (Wort.), or DMSO, collagen was added to washed human platelets. The corresponding aggregation rate (e) was recorded, and Akt phosphorylation (f) was measured. ImageJ software was used to calculate the density of bands. The results are presented as mean ± SEM (n = 3). *p < .05, **p < .01, ***p < .001, and ****p < .0001 vs. DMSO (vehicle)-treated platelets. ####p < .0001 vs. The Wort. (50 nM) group.
Figure 6. QDTT inhibited platelet spreading on fibrinogen-coated surfaces and clot retraction. (a,b) Clot retraction reaction. Each experimental group was repeated three times, and the pictures represent three experiments. **p < .01 vs. The control group (vehicle). (c-h) platelet adherence and spreading after QDTT treatment (magnification × 40, twelve 0.03 mm2 fields of view were taken for each experimental group for counting). (c-f) pictures of QDTT (50, 250, or 500 μM), DMSO-incubated platelets spreading on fibrinogen-coated substrates. (g-h) histogram of platelet spreading inhibition by QDTT. Each experimental group was repeated three times, and the pictures represent three experiments. Spread platelets/filed and total area expressed as mean ± SEM (n = 3). *p < .05, ***p < .001 and ****p < .0001 vs. The DMSO group (vehicle).
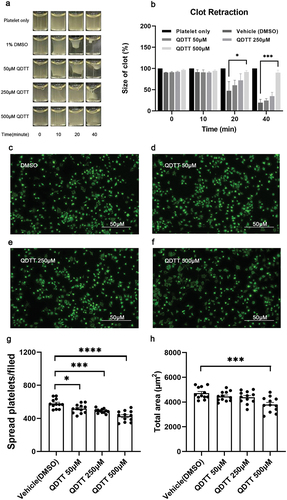
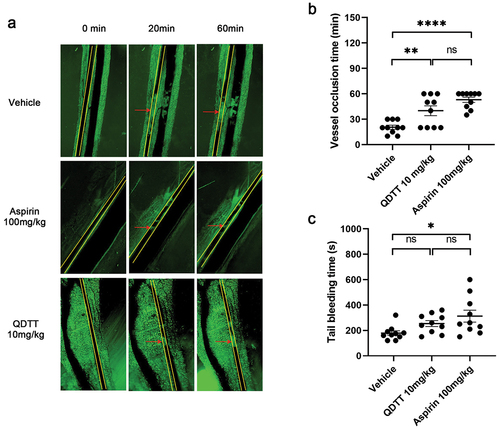
Figure 7. Effects of QDTT on tail bleeding and FeCl3-induced mesenteric arteriolar thrombosis in vivo. (a) QDTT inhibits FeCl3-induced mesenteric arteriolar thrombosis (magnification × 40). (b) summary of the time of arterial occlusion. n = 10 for each group. The results were presented as mean ± SEM. **p < .01, and ****p < .0001 vs. The vehicle group. (c) QDTT, aspirin, or DMSO (control) was injected through the caudal vein 30 min before the experiment. n = 10 for each group. The results are presented as mean ± SEM. *p < .05 vs. The vehicle group. The yellow line represents the artery, and the red arrow represents the small artery thrombosis.