Figures & data
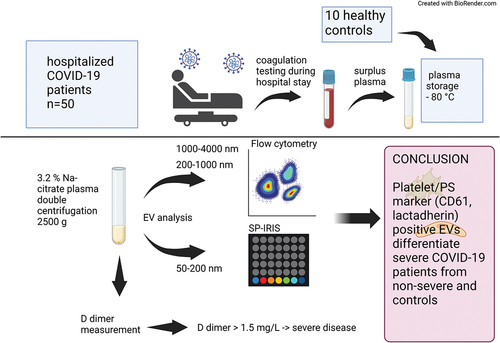
Figure 1. High sensitivity flow cytometry (hsFCM) and single-particle interferometric reflectance imaging sensor (SP-IRIS) were used to isolate and characterize medium and large EVs (200–4000 nm) and small EVs (50–200 nm), respectively. EV, extracellular vesicle; SEC, size-exclusion chromatography; RC, residual cell.
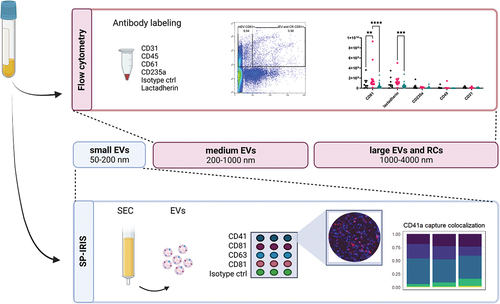
Table I. Summary of the laboratory test results of the 50 patients with COVID-19 infection. Results between high and low D-dimer groups are presented in Supplemental Table S2 and statistically significant differences in supplemental figure S3.
Figure 2. Residual cells/large extracellular vesicles (1000–4000 nm) and medium-sized extracellular vesicles (200–1000 nm) measured by high sensitivity flow cytometry. Markers for red blood cells (CD235a), endothelial cells (CD31), leukocytes (CD45), platelets (CD61), and phosphatidyl serine exposure (lactadherin) were measured. Significant differences between low D-dimer and control groups compared with the high D-dimer >1.5 mg/L are marked with asterisks: *p < .05, **p < .01, ***p < .001. One outlier sample, with particle counts exceeding 6 × 10Citation9/L is not shown. Pairwise comparisons were determined using Mann–Whitney U test, with Bonferroni correction. Box plots show median, 25th and 75th percentiles and range.
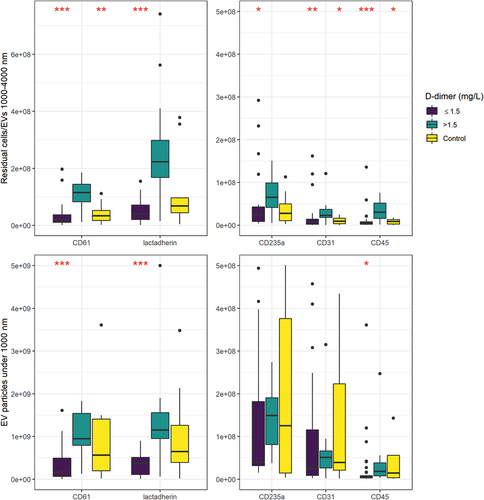
Figure 3. Particle counts and diameters of small EVs 50–200 nm by SP-IRIS (exoview R100). CD41a+, CD63+, CD81+, and CD9+ EV counts were all significantly higher in the high D-dimer group >1.5 mg/L compared to low D-dimer (≤1.5 mg/L) or controls. In terms of particle diameter, CD9+ particles were significantly larger in high D-dimer patients in comparison to low D-dimer patients. Significant differences between low D-dimer and control groups compared with the high D-dimer >1.5 mg/L are marked with asterisks: *p < .05, **p < .01, ***p < .001. Three outliers, with particle count exceeding 3 × 10Citation5 are not shown. Pairwise comparisons were done using Mann–Whitney U test, with Bonferroni correction. Box plots, show median, 25th and 75th percentiles and range.
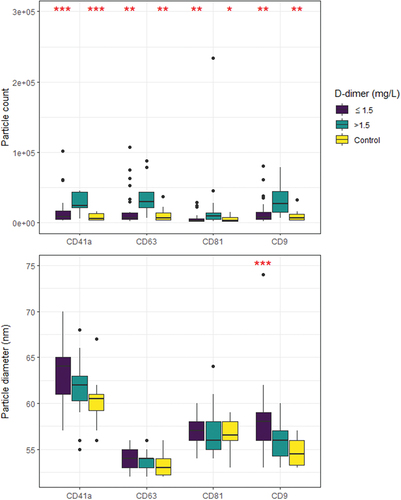
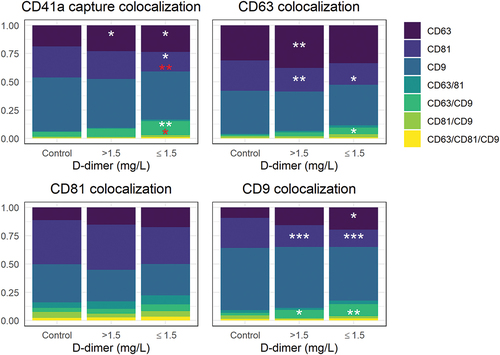
Figure 4. SP-IRIS tetraspanin colocalization analysis with platelet marker CD41a used as the capture antibody, as well as colocalizations with CD63, CD81, and CD9. Results are shown in stacked boxplots as proportions of bound antibodies. Significant differences between controls and low ≤1.5 mg/L and high >1.5 mg/L D-dimer groups are marked with white asterisks: *p < .05, **p < .01, ***p < .001. Significant differences between the high and low D-dimer groups are marked with red asterisks: *p < .05, **p < .01 three outliers, with particle count exceeding 3 × 10Citation5 are not shown.