Figures & data
Figure 1. H-PRF shows the coagulation sequence from the yellow-red junction to the coronal part. (A) Coagulation state of H-PRF with time. (B) Fiber formation during coagulation of H-PRF. (C) Schematic diagram of coagulation of H-PRF. (D) Layer demarcation of H-PRF. (E) The oxygen content of H-PRF in different layers. (n = 6, ***p < 0.001).
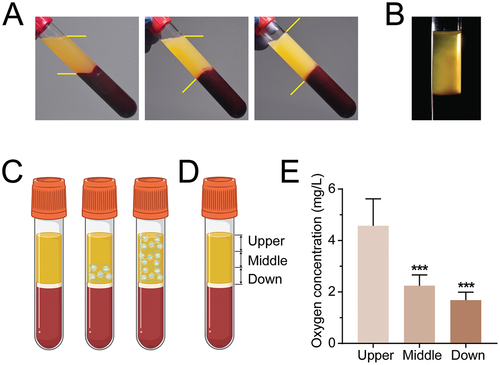
Figure 2. The production flow chart of SHAP tubes.
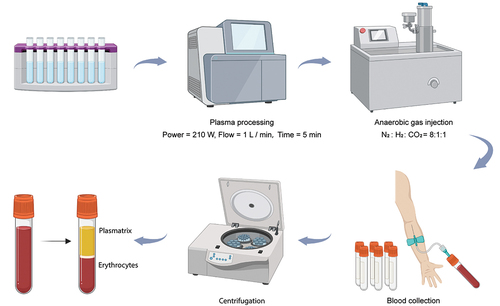
Figure 3. SHAP tubes show good hydrophilicity and different surface topography compared to PM tubes. (A) Comparison of hydrophilicity between PM and SHAP tubes. (B) Contact angle measurement of the inner surface of the blood collection tube. (C) Comparison of morphology between PM and SHAP tubes by SEM. (n = 6, ***p < 0.001).
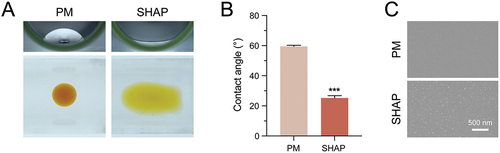
Figure 4. H-PRF prepared by SHAP tubes has a larger size, higher mechanical strength and longer degradation time. (A) Comparison of H-PRF clots prepared by PM and SHAP tubes. (B) Comparison of H-PRF membranes prepared by PM and SHAP tubes. (C) Length analysis of H-PRF clots prepared by PM and SHAP tubes. (D) Area analysis of H-PRF membranes prepared by PM and SHAP tubes. (E) Fracture strain analysis of H-PRF membranes prepared by PM and SHAP tubes. (F) Fracture stress analysis of H-PRF membranes prepared by PM and SHAP tubes. (G) Stress-strain curves of H-PRF membranes prepared by PM and SHAP tubes. (H) SEM observation of the microstructure on the surface and cross-section of H-PRF membranes prepared by PM and SHAP tubes. (I) Degradation of H-PRF membranes prepared by PM and SHAP tubes with time. (n = 6, ***p < 0.001).
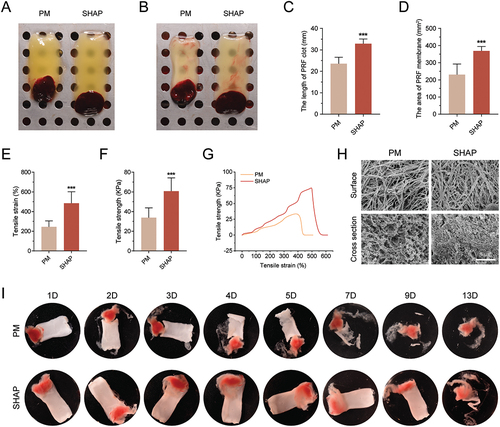
Figure 5. SHAP tubes promote platelet activation within H-PRF. (A) The internal platelet morphology of H-PRF prepared by PM tubes was observed by scanning electron microscope. (B) The internal platelet morphology of H-PRF prepared by SHAP tubes was observed by scanning electron microscope. (C) Flow cytometry compared the platelet activation in different layers of H-PRF prepared by PM and SHAP tubes (n = 6).
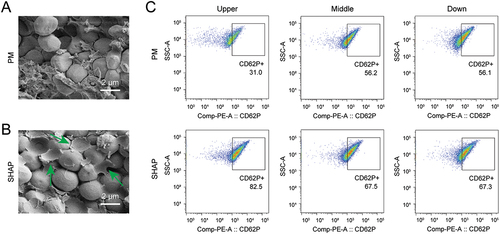
Figure 6. H-PRF prepared by SHAP tubes has better antibacterial, collagen secretion and mineralization promotion effects. (A) Comparison of the inhibition rings of H-PRF membranes prepared by PM and SHAP tubes. (B) Quantification of the inhibition rings in (A). (C) CCK-8 experiment to analyze the effect of H-PRF prepared by PM and SHAP tubes on the proliferation of human gingival fibroblasts. (D) CCK-8 experiment to analyze the effect of H-PRF prepared by PM and SHAP tubes on the proliferation of human osteoblasts; (E) fluorescence staining of the effect of H-PRF prepared by PM and SHAP tubes on collagen secretion of human gingival fibroblasts. (F) Quantification of fluorescence staining in (E). (G, H). ALP staining of human osteoblasts after 7 days of mineralization. (I) Alizarin red staining of human osteoblasts after 14 days of mineralization. (J) ALP activity analysis of human osteoblasts after 7 days of mineralization. (K) Quantification of staining in (I). (n = 6, ***p < 0.01 and ***p < 0.001).
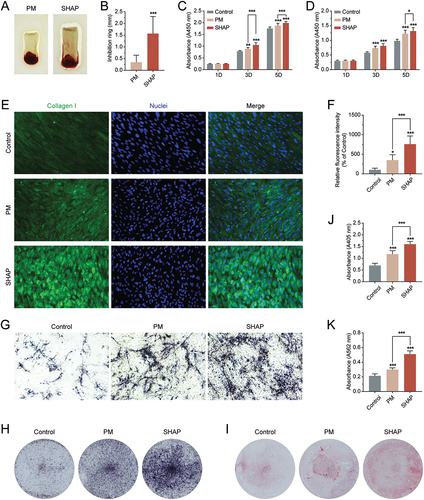
Figure 7. H-PRF prepared by SHAP tubes improved significantly in patients with poor coagulation function. (A) Coagulation effect of H-PRF prepared by PM and SHAP tubes after centrifugation. (B) Coagulation time of H-PRF prepared by PM and SHAP tubes in patients with poor coagulation function. (C) Fracture stress analysis of H-PRF membranes prepared by PM and SHAP tubes. (D) Stress-strain curves of H-PRF membranes prepared by PM and SHAP tubes. (n = 3, ***p < 0.05 and ***p < 0.01).
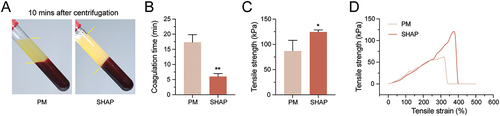
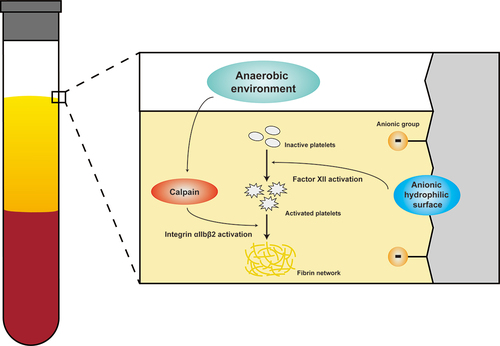
Figure 8. The schematic diagram illustrate the mechanism that the SHAP tubes with the anaerobic gas environment and the super-hydrophilic surface can activate the platelet clotting cascade and thus promote the fibrin network and H-PRF formation.