Figures & data
Table I. Related gene primer sequences for RT-PCR and qPCR analysis.
Figure 1. Differences in appearance and release of bioactive components between fresh PRP and cPRP. (a) A photograph of fresh PRP. (b) A photograph of PRP passing through − 80°C freezing. (c) A photograph of cPRP. (d) The cumulative release profiles of the cytokine IL-1β in fresh and cryopreserved PRP. (e) The cumulative release profiles of the cytokine PDGF-BB in fresh and cryopreserved PRP.
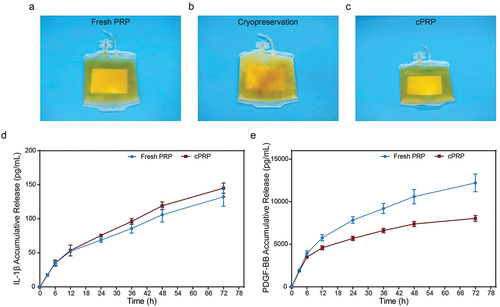
Figure 2. Quantifying cytokine levels in fresh PRP and cPRP. (a–c) the concentration of the cytokine PDGF-BB (a), VEGF (b) and IL-10 (c) in pre-collection plasma, fresh PRP, and cPRP. The above data are expressed as mean ± standard deviation, ns, not significant; *p < .05, **p < .01, ***p < .001, ****p < .0001.
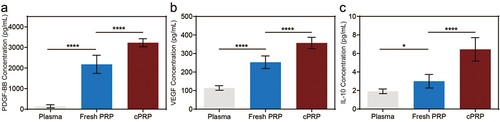
Figure 3. The comparison of in vitro cell evaluation between the fresh PRP and cPRP. (a) Fluorescence images of co-cultured macrophages with the fresh PRP and cPRP, respectively. The macrophage polarization was evaluated through CD206/DAPI immunofluorescence staining (green: CD206; blue: DAPI). The scale bars are 20 µm. (b) Statistical analysis results of average fluorescence intensity of CD206 of fresh PRP and cPRP co-culturing macrophages. (c, d) compare the expression levels of macrophage polarization related genes IL-10 (c) and IL-6 (d) after 3 days and 5 days coculturing. GAPDH as the internal reference to calculate the ct value. (e, f) CCK-8 absorbance values were obtained by co-culturing L929 cells (e), and HUVEC cells (f), with the fresh PRP and cPRP for 1 day, 3 days, and 5 days, respectively. (g, i) scratch test and migration area percentage statistical results of L929 in 5% fresh PRP and 5% cPRP for 12 hours. (h, j, k) after culturing HUVECs in a culture medium containing 5% fresh PRP and 5% cPRP for 4 hours, the number of meshes (j) and total length (k) were statistically analyzed. (l) The mRNA expression of angiogenesis-related gene VEGF is assessed using qPCR after 3 days, 5 days, and 7 days of HUVEC training with the fresh PRP and cPRP. The above data are expressed as mean ± standard deviation, ns, not significant; *p < .05, **p < .01, ***p < .001, ****p < .0001.
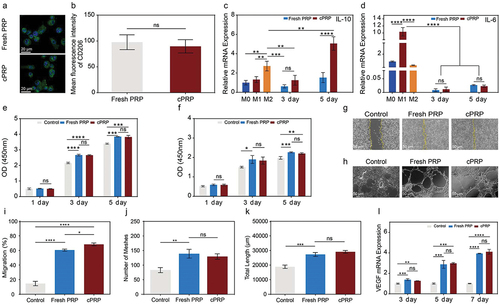
Figure 4. Effect of cPRP concentration on polarization of macrophages. (a) Fluorescence images of co-cultured macrophages with three groups of cPRP with varying concentration. The macrophage polarization was evaluated through CD206/DAPI immunofluorescence staining (green: CD206; blue: DAPI). (b) Statistical analysis results of average fluorescence intensity of CD206 of fresh PRP and cPRP co-culturing macrophages. (c, d) the expression levels of macrophage polarization related genes IL-6 (c), and IL-10 (d), after co-culturing with three cPRP concentration groups for 3 days and 5 days. (e–g) statistical charts of the expression levels of CD80, CD163, and CD206, markers of M0, M1, and M2 macrophages. (h–j) statistical charts comparison of the differences in the expression of macrophage surface markers CD80, CD163, and CD206 after co-culturing with three cPRP concentration groups. The above data are expressed as mean ± standard deviation, ns, not significant; *p < .05, **p < .01, ***p < .001, ****p < .0001.
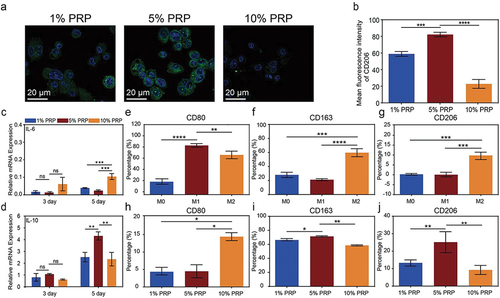
Figure 5. Effect of cPRP concentration on the proliferation and migration fibroblast. (a) The results of CCK-8 absorbance values after co-culturing L929 cells with three cPRP concentration groups for 1 day, 3 days, and 5 days, respectively. (b) Cell viability analysis after co-culturing L929 cells with three cPRP concentration groups for 1 day, 3 days, and 5 days. (c, d,) scratch test and migration area percentage statistical results of L929 in culture media containing different final concentrations of cPRP for 12 hours. The above data are expressed as mean ± standard deviation, ns, not significant; *p < .05, **p < .01, ***p < .001, ****p < .0001.
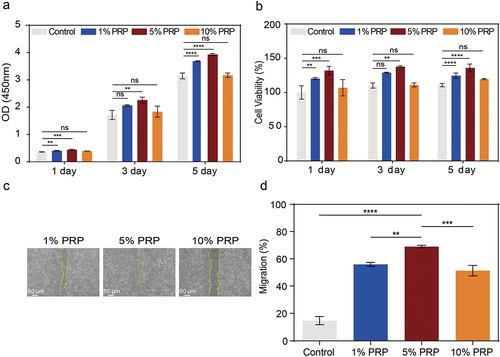
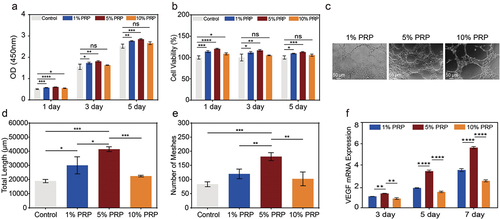
Figure 6. Effect of cPRP concentration on the vascularization and proliferation of HUVECs. (a) The results of CCK-8 absorbance values after co-culturing HUVECs with three cPRP concentration groups for 1 day, 3 days, and 5 days, respectively. (b) Cell viability analysis after co-culturing HUVECs with three cPRP concentration groups for 1 day, 3 days, and 5 days. (c–e) after culturing HUVECs for 4 hours in culture medium containing different final concentrations of cPRP(c), the total length of in vitro angiogenesis (d) and the number of meshes (e) were statistically analyzed. (f) After co-culturing with HUVECs at different final concentrations of cPRP for 3 days, 5 days, and 7 days, q-PCR showed mRNA expression of angiogenesis-related gene VEGF. The above data are expressed as mean ± standard deviation, ns, not significant; *p < .05, **p < .01, ***p < .001, ****p < .0001.