Figures & data
Figure 1. Velocity profile of fluid flow through a cylinder.Citation5 Lower left panel: no-slip boundary condition. Middle left panel: partial slip. Upper left panel: perfect slip. True slip (upper right panel) indicates the slip layer at the boundary is of molecular dimension, and effective (or apparent) slip (lower right panel) indicates the local velocity varies over a finite, albeit small, mesoscopic distance. Fluid flow is in the z-direction, steady, laminar and incompressible. R = cylinder inside radius; uR = fluid velocity at cylinder inside surface (“slip velocity”); umax = maximum flow velocity.
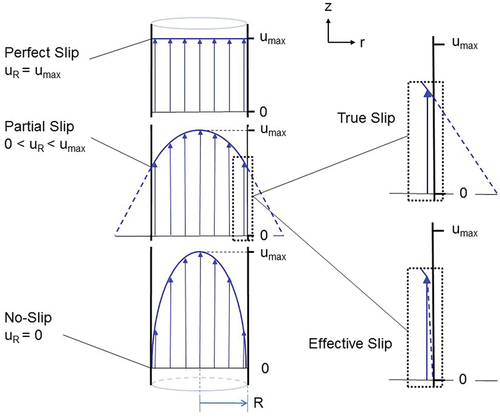
Figure 2. Representative illustrations from the validated model of platelet slip at vascular stenosis and near PCI device surfaces.Citation5 Platelets were modeled using 3.12 μm diameter polystyrene (non-adhesive) microspheres. The model test section was cylindrical, flow was continuous, and the view presented is longitudinal of the horizontal middle plane. The velocities of the microspheres were determined by laser-Doppler velocimetry (blue rings and discs: ○;●). These velocities were compared with COMSOL Multiphysics computer-simulations of plasma velocity profiles (black solid lines). The model had the capacity to insert a central solid cylinder to model a PCI guide wire (a “cylinder-within-a-cylinder”). The was 20–90% by cross sectional area. The Reynolds number of 300 is within the range of coronary flow.Citation25 All velocities were normalized to the mean velocity u0, calculated from direct volumetric measurement of bulk fluid flow. Computer simulations applied the no-slip boundary condition at each surface, noting wall shear stresses in the unobstructed coronary circulation promote minimal plasma slip.Citation56 The blue discs (●) highlight partial or effective slip (i.e.: non-zero velocity) of microspheres immediately adjacent to the surfaces of the stenoses and central cylinder surface. PCI = percutaneous coronary intervention.
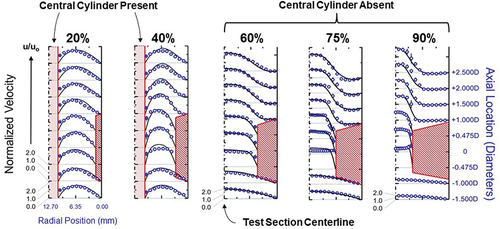
Figure 3. Comparison of perfused whole blood platelet adhesion to collagen (% Area covered) at shear rates 1000 –10 000 sec−1 with no inhibitors, VHH81 (14 μg/mL) or ARC1172 (1 μM) mixed with recalcified blood before perfusion.Citation12 Comparison between platelet coverage [adhesion] was analyzed with a two-way ANOVA with mixed effects and Tukey’s multiple comparison correction. p values after multiple comparison corrections are displayed for relevant groups. Data are means±standard deviation with n = number of fields analyzed per condition. Reproduced with permission.
![Figure 3. Comparison of perfused whole blood platelet adhesion to collagen (% Area covered) at shear rates 1000 –10 000 sec−1 with no inhibitors, VHH81 (14 μg/mL) or ARC1172 (1 μM) mixed with recalcified blood before perfusion.Citation12 Comparison between platelet coverage [adhesion] was analyzed with a two-way ANOVA with mixed effects and Tukey’s multiple comparison correction. p values after multiple comparison corrections are displayed for relevant groups. Data are means±standard deviation with n = number of fields analyzed per condition. Reproduced with permission.](/cms/asset/40bbb79a-0738-4a69-948e-9c50e1bf25cc/iplt_a_2353582_f0003_oc.jpg)
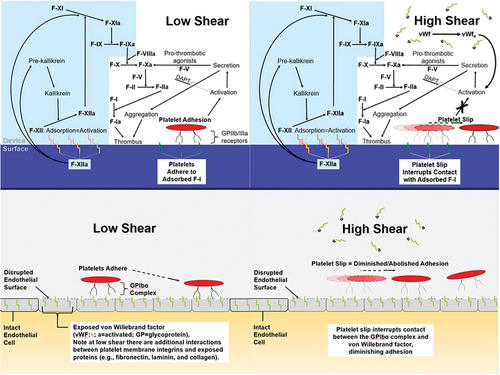
Figure 4. Effect of shear rate on platelets at a PCI device surface (upper panel)Citation5 and at a site of endothelial disruption (lower panel). Left-low shear; Right-high shear.