Figures & data
Table I. Study cohort demographics. Clinical characteristics of the included control subjects and ET patients. ET: essential thrombocythemia. n.d.: mutation analysis not performed.
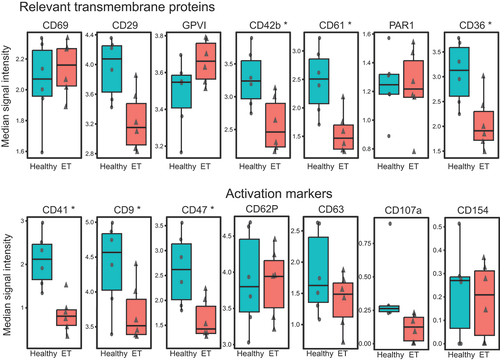
Figure 1. Receptor expression in non-stimulated platelets. A. Median signal intensity of relevant constitutive transmembrane receptors and activation markers in non-stimulated platelets of healthy controls (n = 6, plotted in blue) and ET patients (n = 6, plotted in red). The horizontal line within the box plot represents the median, the top and bottom the interquartile range (Q1–Q3), whisker bars indicate the largest observation that is less than or equal to the upper inner fence (UIF = Q3 + 1.5 × IQR) or the smallest observation that is greater than or equal to the lower inner fence (LIF = Q1–1.5 × IQR) and each dot represents the median expression of one sample. * p < .05. B. Uniform manifold approximation and projection (UMAP) of ET patients (n = 6) and healthy controls (n = 6) after equal random sampling from each sample and scaled, arcsinh-transformed expression [0–1] for activation markers colored according to the expression level. C. Multidimensional analysis of platelet subpopulations. OptSNE (optimized t-distributed stochastic neighbor embedding) plots of one exemplary healthy donor and one ET patient are shown for the expression of the activation markers and transmembrane receptors in non-stimulated platelets. Color intensity refers to expression (low [blue] or high [red]) and each dot represents a single platelet. ET: essential thrombocythemia.
![Figure 1. Receptor expression in non-stimulated platelets. A. Median signal intensity of relevant constitutive transmembrane receptors and activation markers in non-stimulated platelets of healthy controls (n = 6, plotted in blue) and ET patients (n = 6, plotted in red). The horizontal line within the box plot represents the median, the top and bottom the interquartile range (Q1–Q3), whisker bars indicate the largest observation that is less than or equal to the upper inner fence (UIF = Q3 + 1.5 × IQR) or the smallest observation that is greater than or equal to the lower inner fence (LIF = Q1–1.5 × IQR) and each dot represents the median expression of one sample. * p < .05. B. Uniform manifold approximation and projection (UMAP) of ET patients (n = 6) and healthy controls (n = 6) after equal random sampling from each sample and scaled, arcsinh-transformed expression [0–1] for activation markers colored according to the expression level. C. Multidimensional analysis of platelet subpopulations. OptSNE (optimized t-distributed stochastic neighbor embedding) plots of one exemplary healthy donor and one ET patient are shown for the expression of the activation markers and transmembrane receptors in non-stimulated platelets. Color intensity refers to expression (low [blue] or high [red]) and each dot represents a single platelet. ET: essential thrombocythemia.](/cms/asset/80941f46-d6f7-4400-bd35-ca7f08073c1b/iplt_a_2358244_f0001_oc.jpg)
Table II. Comparison of receptor expression in healthy controls and ET patients. Mean, median signal intensity and EMD values are given at baseline and following TRAP stimulation. ET: essential thrombocythemia; EMD: earth mover’s distance; TRAP: thrombin receptor-activating peptide, adj: Benjamini-Hochberg false discovery rate adjusted p-value.
Figure 2. Platelet count and correlation with mean platelet volume in ET patients and healthy controls. a. Bar plot illustrating the platelet count ± SEM in healthy donors (blue) and ET patients (red), (n = 6). Data were log-transformed to address the zero-limit issue, followed by an unpaired t-test (p = .0123). a. Bar plot illustrating the mean platelet volume ± SEM in healthy donors (blue) and ET patients (red), (n = 6). Unpaired t-test (p = .014). C. Correlation plots depicting the relationship between the logged platelet count (G/L) and Mean Platelet Volume (MPV, fL) for both healthy donors and ET patients. For healthy donors, a Pearson correlation coefficient (r) of − 0.6963 was observed (95% confidence interval: −0.9630 to 0.2706; p = .1268). In contrast, ET patients exhibited a stronger negative correlation, with an r of − 0.9654 (95% confidence interval: −0.9963 to − 0.7104; p = .0018), indicating a significant inverse relationship between platelet count and MPV in this patient group. ET: essential thrombocythemia.
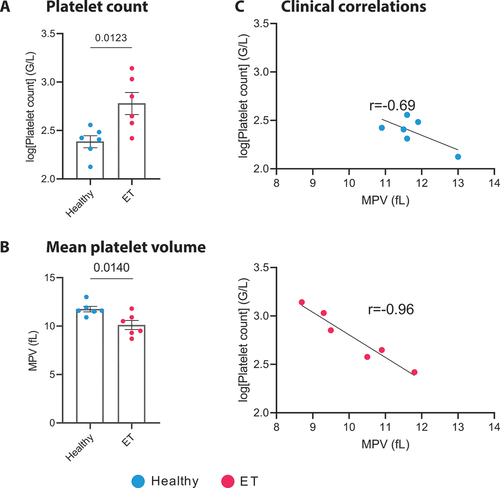
Figure 3. Subpopulation clustering analysis in non-stimulated platelets. a. UMAP representation of FlowSOM clustering result of healthy platelets (n = 6, left panel) and ET platelets (n = 6, right panel). Platelets were clustered into SOM (self-organizing map) of clusters, which were then merged into eight meta-clusters. Colors indicate clusters 1–8. b. Median signal intensity of transmembrane and activation markers in two subclusters differentially regulated in healthy controls and ET patients. Depicted markers show statistically significant differences in protein expression between healthy controls and ET patient samples within respective clusters. Cluster 3: CD63 (0.09 vs. 0.33 MSI, p = .034) and GPVI (2.77 vs. 3.36 MSI, p = .034). Cluster 8: CD62P (2.48 vs. 3.15 MSI, p = .018), GPVI (4.47 vs. 4.99 MSI, p = .018), CD69 (2.77 vs. 3.19 MSI, p = .018) and PAR1 (2.35 vs. 2.69 MSI, p = .018). The horizontal line within the box plot represents the median, the top and bottom the interquartile range (Q1–Q3), whisker bars indicate the largest observation that is less than or equal to the upper inner fence (UIF = Q3 + 1.5 × IQR) or the smallest observation that is greater than or equal to the lower inner fence (LIF = Q1–1.5 × IQR) and each dot represents the mean expression of one sample. * p < .05. c. Comparative heatmap of individual clusters. Heatmap depicts the marker median signal intensity of healthy donors and ET patients for each cluster in non-stimulated platelets (low [gray] and high [green] median signal intensity). ET: essential thrombocythemia.
![Figure 3. Subpopulation clustering analysis in non-stimulated platelets. a. UMAP representation of FlowSOM clustering result of healthy platelets (n = 6, left panel) and ET platelets (n = 6, right panel). Platelets were clustered into SOM (self-organizing map) of clusters, which were then merged into eight meta-clusters. Colors indicate clusters 1–8. b. Median signal intensity of transmembrane and activation markers in two subclusters differentially regulated in healthy controls and ET patients. Depicted markers show statistically significant differences in protein expression between healthy controls and ET patient samples within respective clusters. Cluster 3: CD63 (0.09 vs. 0.33 MSI, p = .034) and GPVI (2.77 vs. 3.36 MSI, p = .034). Cluster 8: CD62P (2.48 vs. 3.15 MSI, p = .018), GPVI (4.47 vs. 4.99 MSI, p = .018), CD69 (2.77 vs. 3.19 MSI, p = .018) and PAR1 (2.35 vs. 2.69 MSI, p = .018). The horizontal line within the box plot represents the median, the top and bottom the interquartile range (Q1–Q3), whisker bars indicate the largest observation that is less than or equal to the upper inner fence (UIF = Q3 + 1.5 × IQR) or the smallest observation that is greater than or equal to the lower inner fence (LIF = Q1–1.5 × IQR) and each dot represents the mean expression of one sample. * p < .05. c. Comparative heatmap of individual clusters. Heatmap depicts the marker median signal intensity of healthy donors and ET patients for each cluster in non-stimulated platelets (low [gray] and high [green] median signal intensity). ET: essential thrombocythemia.](/cms/asset/34125e29-c9c1-4d47-b516-44ad8161db72/iplt_a_2358244_f0003_oc.jpg)
Figure 4. Receptor expression after TRAP-induced activation. Median signal intensity of relevant transmembrane receptors and activation markers in platelets after stimulation with 10 µM TRAP in healthy controls (n = 6, plotted in blue) and ET patients (n = 6, plotted in red). The horizontal line within the box plot represents the median, the top and bottom the interquartile range (Q1–Q3), whisker bars indicate the largest observation that is less than or equal to the upper inner fence (UIF = Q3 + 1.5 × IQR) or the smallest observation that is greater than or equal to the lower inner fence (LIF = Q1–1.5 × IQR) and each dot represents the mean expression of one sample. ns: nonsignificant. * p < .05. ET: essential thrombocythemia; TRAP: thrombin receptor-activating peptide.