Figures & data
Table I. The molecular docking of EPAG showing binding affinity.
Table II. A gird for ligands.
Table III. Primer sequences.
Schema 1. A schematic representation illustrates the EPAG and its molecular mechanism in cellular proliferation.
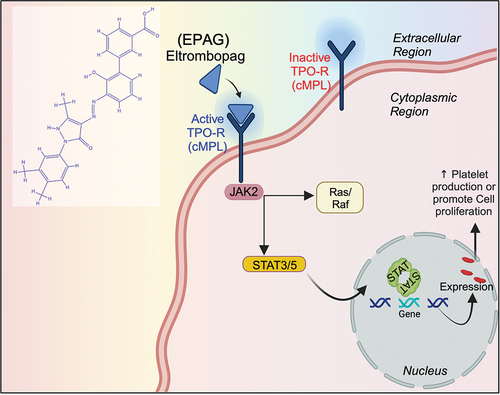
Figure 1. The docked poses reveal the binding mode of various proteins, including cMPL, JAK-2, RAS, and STAT-3, into the binding capacity of EPAG. The ribbon structure illustrates the 3D protein structure of these molecules (A, B, C, D – i and ii), while the H-Bonds (A, B, C, D – iii) demonstrate the strong binding affinity of the ligand (EPAG).
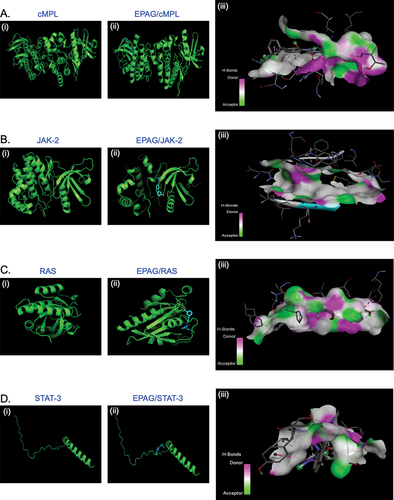
Figure 2. The conformation of EPAG is docked with cMPL (A), JAK-2 (B), RAS (C), and STAT-3 (D) ligands, revealing the interaction with important residues in the active site cleft.
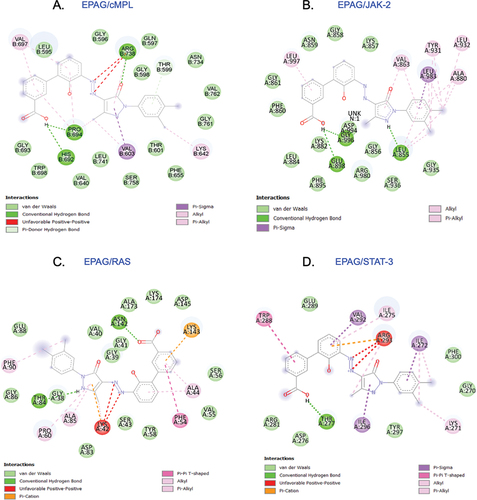
Figure 3. EPAG was subjected to molecular dynamic simulation. The results show the Protein backbone RMSD for each ligand-protein complex (A, B, C, and D – i). Additionally, the study observed the H-bond interactions between each Protein (cMPL, JAK-2, RAS, and STAT-3) and EPAG (A, B, C, and D – ii).
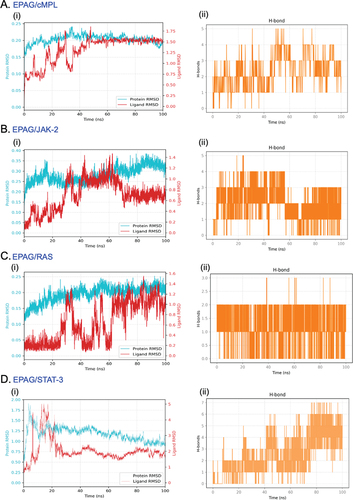
Figure 4. MTT assay shows the effects of EPAG on MEG-01 (Positive control), hUCMSC, and hGMSC, which are shown in (A), illustrating their percentage of cytotoxic properties. The non-linear regression model was performed to calculate the Inhibitory concentration of 50% cell death (IC-50) from 0 to 100 μM of EPAG on three different cells (B, C & D). The3H thymidine incorporation assay shows the proliferation efficiency of EPAG two dose for 48 h on all three cells compared to non-treated cells (E). Calcein AM staining confirms the enhanced proliferation of EPAG on all three cells; images were captured with 20 × magnification, 10 μm scale bar (F). Immunofluorescence analysis confirms the presence of F-actin, cMPL, and Hoechst 33 342 used to counterstain the nucleus shown in the (G). Images were captured 40 × magnifications, 20 μm scale bar.
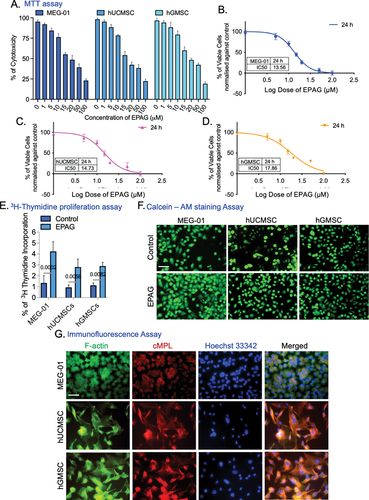
Figure 5. Flow cytometry analysis confirms the phenotypes of hUCMSC-ECs and hGMSC-ECs. The results show that hUCMSC-ECs have a VEGF-A expression of 42.9% and CD31 expression of 53.4% (A), while hGMSC-ECs have a VEGF-A expression of 44.1% and CD31 expression of 54.8% (B). The phase-contrast image (10X magnification, 10 μm scale bar) shows the differentiated endothelial-like cells obtained from hUCMSC and hGMSC (C). Immunofluorescence staining confirms the positive expression of VEGF-A and Propidium Iodide (PI) counterstain the nucleus, and images were captured with 60X magnifications, 40 μm scale bar (D). Confirmation of capillary-like structure confirmed by CD31 immunostaining for 24 and 48 h of both ECs; images were captured with 20X magnification, 20 μm scale bar (E). Gene expression profile specific to ECs shows the expression of RUNX-1 GFI-1b, VEGF-A, MYB, FOG-1, and FLI-1 (F-K). The expression levels were normalized using Tata-box binding protein (TBP). A heat map illustrates the Euclidean distance of the targeted gene expression pattern. Blue represents lower values, while red represents higher values (L).
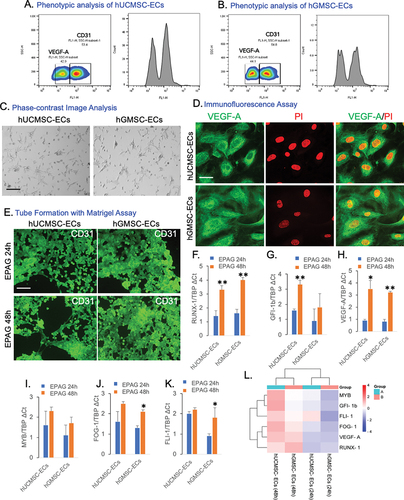
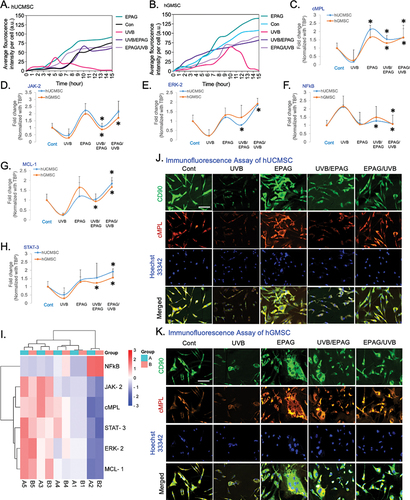
Figure 6. The analysis of live and dead cells in the UVB radiation model demonstrates the average fluorescent intensity of hUCMSC (A) and hGMSC (B) over a period of 0 – 15 hours. The gene expression analysis of EPAG treated UVB model, specifically shows the cMPL, NFκB, JAK-2, STAT-3, ERK-2, and MCL-1. The results were then normalized with TBP (C-H). A heat map represents the Euclidean distance of the targeted gene expression pattern (I). In addition, Immunofluorescence analysis confirms the expression change of CD90/cMPL protein in the control, UVB, EPAG, UVB/EPAG & EPAG/UVB groups of hUCMSC (J) and hGMSC (K). Images were captured with 40X magnification with a 20 μm scale bar.