
Figures & data
Figure 1. Patient enrollment.
AMI, acute myocardial infarction; DAPT, dual antiplatelet therapy; PCI, percutaneous coronary intervention; NSTEMI, non-ST segment elevation myocardial infarction; STEMI, ST segment elevation myocardial infarction; ARC-HBR, the Academic Research Consortium-High Bleeding Risk; PPI, proton pump inhibitor.
Table I. Clinical characteristics of patients.
Table II. One-year clinical endpoints in patients with AMI.
Figure 2. Cumulative Kaplan-Meier curve estimates of NACE (A), MACCE (B), and BARC 2, 3, or 5 (C) at 1 year in patients with AMI.
NACE, net adverse clinical event; MACCE, major adverse cardiac and cerebral events; BARC, Bleeding Academic Research Consortium; HR, hazard ratio; CI, confidence interval.
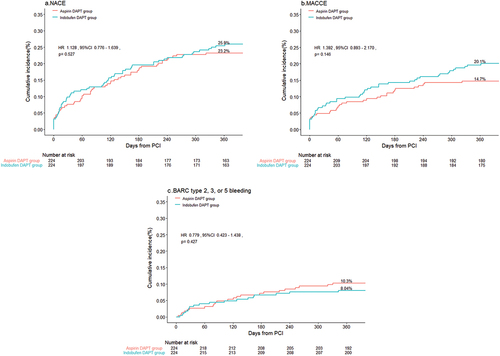
Figure 3. 1-year Gastrointestinal symptoms in the patients with AMI.
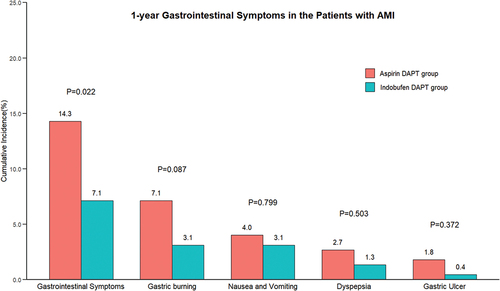
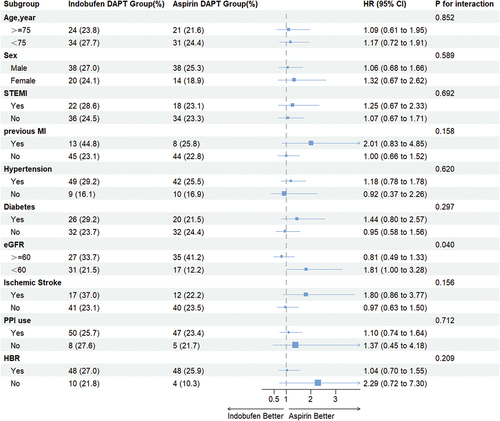
Figure 4. Subgroup analyses for primary endpoints (NACE) of the patients with AMI.
NACE, net adverse clinical event; STEMI, ST segment elevation myocardial infarction; MI, myocardial infarction; PPI, proton pump inhibitor; HBR, high bleeding risk; HR, hazard ratio; CI, confidence interval.
Supplemental material
Supplementary Material
Download ()Data availability statement
The datasets generated during and/or analyzed during the current study are not publicly available as the data also forms part of another ongoing study but are available from the corresponding author on reasonable request.