
Figures & data
Figure 1. Schematic diagram of the bread SC in the UK.
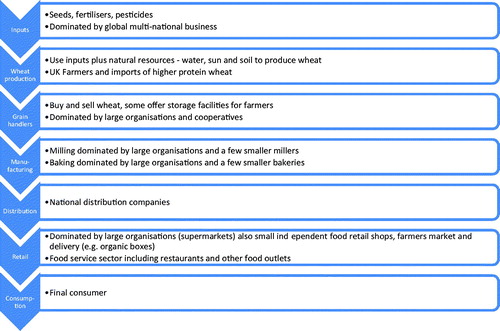
Figure 2. Primary energy consumption in baking bread in MJ/kg, for large industrial, smaller scale and home baking. Data include measurements and results from LCA studies from various literature sources (Masanet, Therkelsen, and Worrell Citation2012; Espinoza-Orias, Stichnothe, and Azapagic Citation2011; Thomsson Citation1999; Carbon Trust 2010; Andersson and Ohlsson Citation1999; Braschkat et al. Citation2004; Beech Citation1980; Le-bail et al. Citation2010). The number of cases is shown below each boxplot, with the number of literature sources shown within brackets.
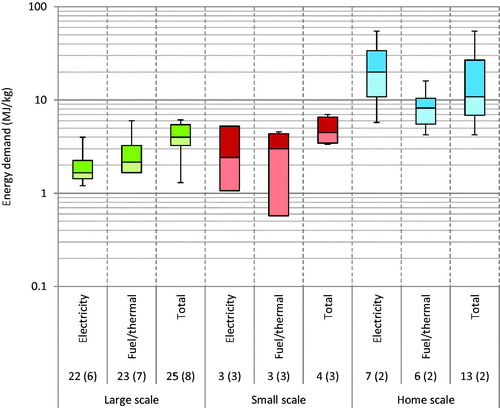
Table 1. Net import and export of prepared or preserved tomatoes by the UK in 2014 (Harvard University 2016).
Table 2. Interconnection of decisions at different layers related to food RDM and the FEW nexus.