
Figures & data
Table 1. Sample demographics.
Table 2. Results of CFA results and goodness of fit statistics.
Table 3. Means, standard deviations and correlations.
Figure 1. Total, direct and indirect effects of the serial mediation model. Notes. N = 271, ***p < 0.001; **p > 0.01; *p > 0.05.
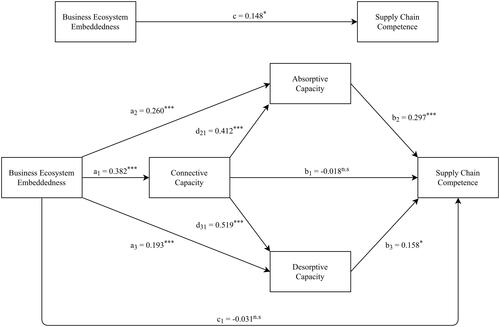
Table 4. Regression coefficients, standard errors and model summary of the serial multiple mediation model.