
Figures & data
Figure 1. Conceptual model.
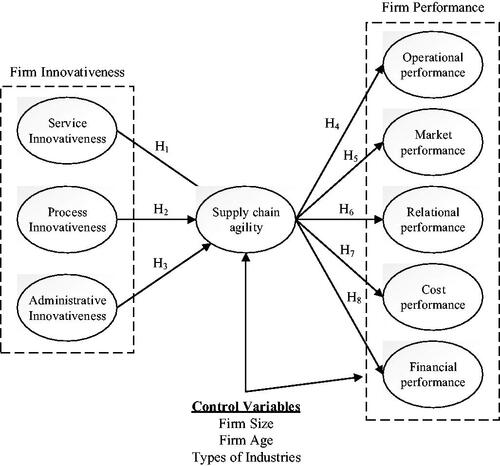
Table 1. Scale validity and reliability.
Table 2. Discriminant validity test using Fornell–Larcker criterion and HTMT ratio.
Table 3. Discriminant validity test using cross-loading.
Figure 2. Result of path analysis. Note: (1) ***p < 0.001; **p < 0.01; *p < 0.05. (2) For visual clarity, the paths between control variables and dependent variables were not shown in the figure.
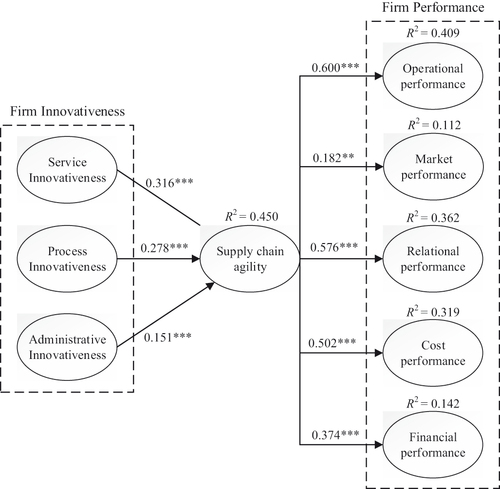
Table 4. Hypothesis testing.
Table 5. Assessment of nonlinearity effects.
Table 6. Assessment of endogeneity.
Table A1. Items description.
Table A2. Post hoc analysis – Mediation test.