Figures & data
Figure 1. The research process.
Table 1. n = 2, Cournot model.
Figure 2. Technology co-appearance network.
Figure 3. TC of HD-DVD.
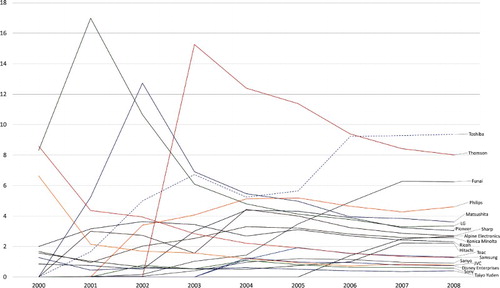
Figure 4. TC of Blu-ray.
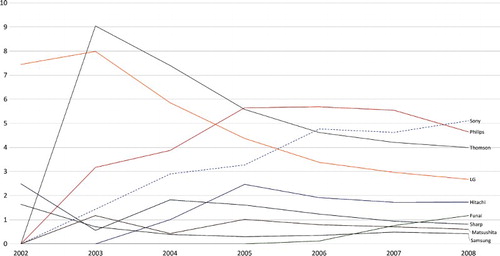
Figure 5. Annual network size.
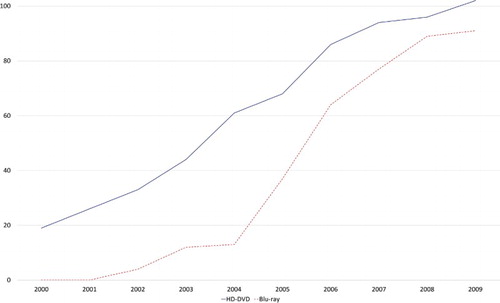
Figure 6. Annual network density.
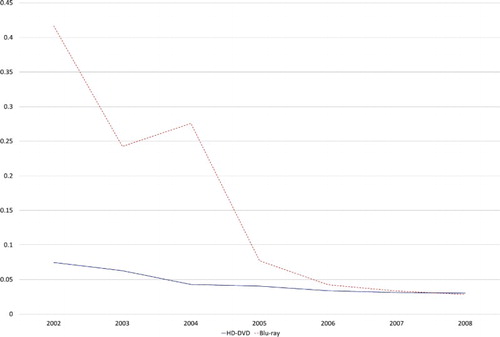
Figure 7. TA of HD-DVD and Blu-ray.
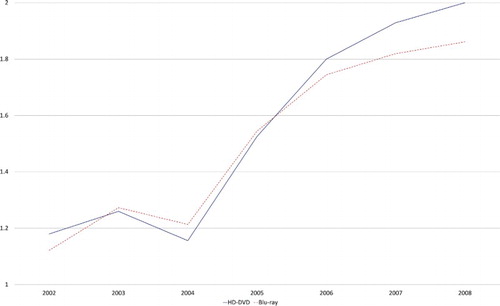
Figure 8. Absolute preference on HD-DVD.
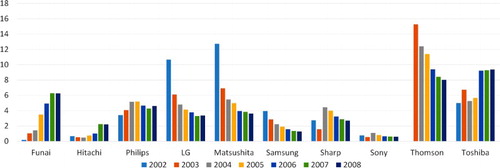
Figure 9. Absolute preference on Blu-ray.
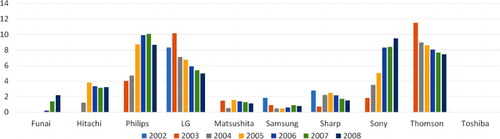
Figure 10. Annual technology differentiation.
Table 2. Firm’s technology relative preference.
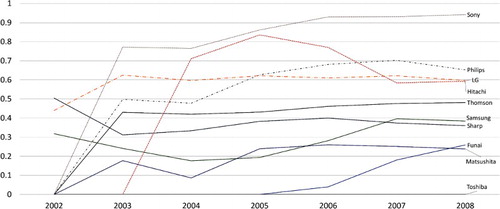
Figure 11. Firm’s relative preference.