Figures & data
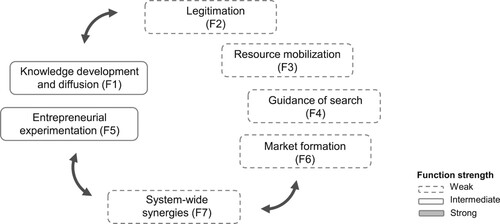
Table 1. Functions of innovation systems and their indicators of strength (Bergek et al. Citation2008; Hekkert et al. Citation2007; Larisch, Amer-Wåhlin, and Hidefjäll Citation2016; Markard and Truffer Citation2008; Rickne Citation2000).
Table 2. Categorisation of AI healthcare technology innovations based on end-user applications.
Table 3. Metrics are used to rank the level of adoption AI healthcare technology innovations.
Table 4. Categorisation of participants from companies a, b, c, d, e and f.
Figure 1. Selection of key actors inspired by Larisch, Amer-Wåhlin, and Hidefjäll (Citation2016). Boxes indicate study participants included in phases I–III. Dotted boxes indicate actors who were contacted to identify participants for phases I–II.
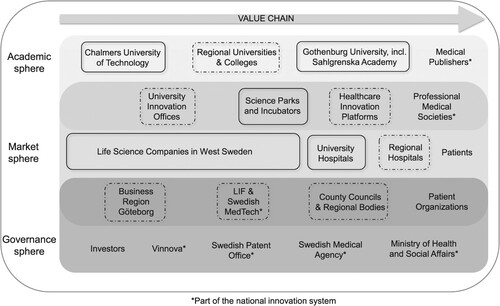
Figure 2. The number of published scientific articles related to AI healthcare technology innovations in Sweden and in West Sweden during 1998–2017.
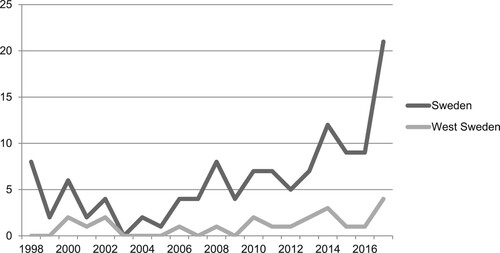
Table 5. Level of commercially deployed AI healthcare technology innovations.
Table 6. Level of adoption of commercially deployed AI healthcare technology innovations according to study participants.
Table 7. Identified system strengths and weaknesses.
Figure 3. Interactions between system functions for AI healthcare technology innovations.
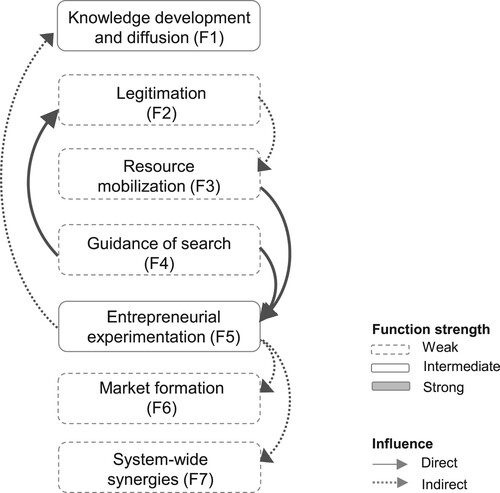
Figure 4. System-blocking mechanisms relating to the innovation system performance.
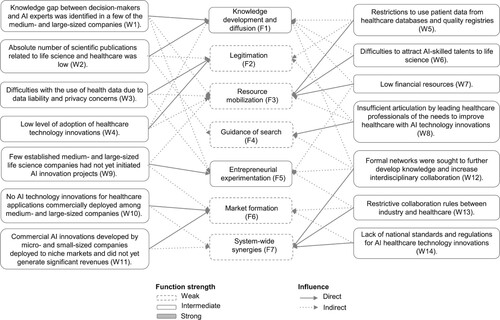
Figure 5. Interdependencies between system functions relating to the innovation system performance.