Figures & data
Figure 1. Total fixed investment, net exports, and consumption as a percentage of GDP (1950–2018). Source: IMF (Citation2019), ISTAT (Citation2019).
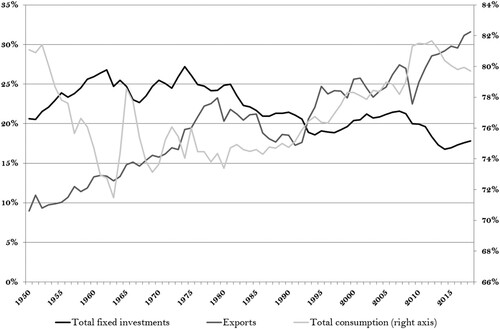
Table 1. GDP and GDP per capita 2017 in Italy (current prices, million euros).
Table 2. Nexuses between variables (output, fiscal balance, government debt, interest rate, spread, and exchange rate).
Figure 2. Real interest rate, GDP growth, primary balance as a percentage of GDP, interest payments as a percentage of GDP, and gross debt as a percentage of GDP (1980–2018) in Italy. Source: IMF (Citation2019), ISTAT (Citation2019).
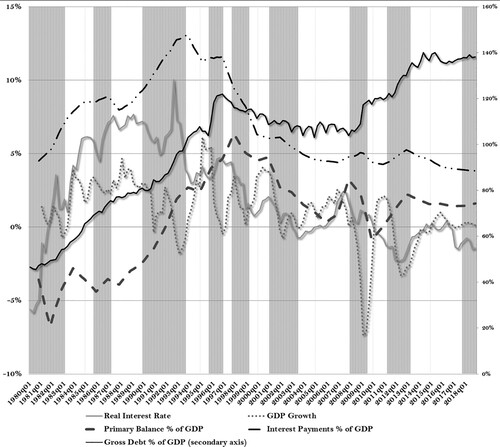
Figure 3. Evolution of the sustainability of Italian public debt following Sylos Labini (first criterion on the left graph, second criterion on the right graph) (1982–2018 — cumulative values). Source: IMF (Citation2019), ISTAT (Citation2019).
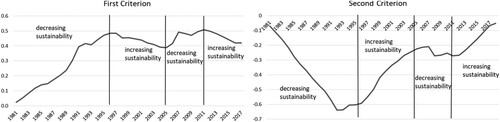
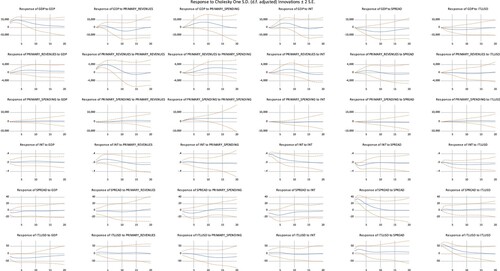
Figure 4. Impulse response functions to innovations of one standard deviation for Model 1.
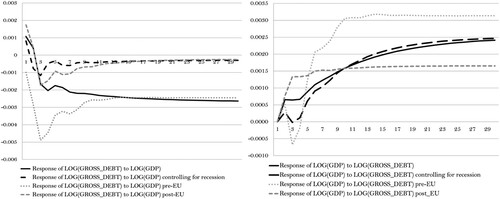
Figure 5. Government, private-sector, and foreign net borrowing as a percentage of GDP (1991–2018) in Italy. Source: ISTAT (Citation2019).
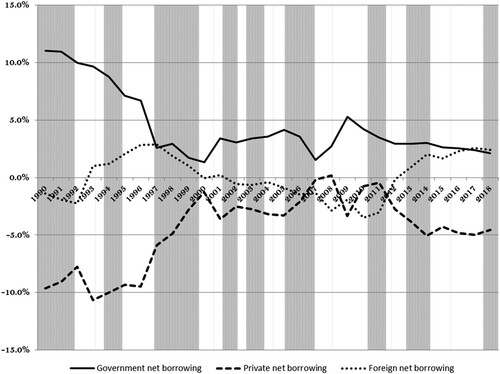
Figure 6. Countercyclical fiscal policy in Italy: debt-to-GDP ratio and primary deficit as a percentage of GDP (1981–2018). Source: ISTAT (Citation2019).
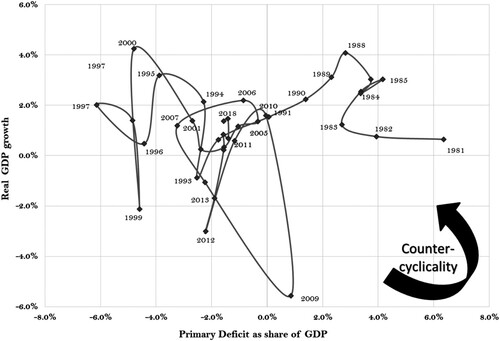
Figure 7. Variance decomposition using Cholesky factors of Model 2 (1980–98).
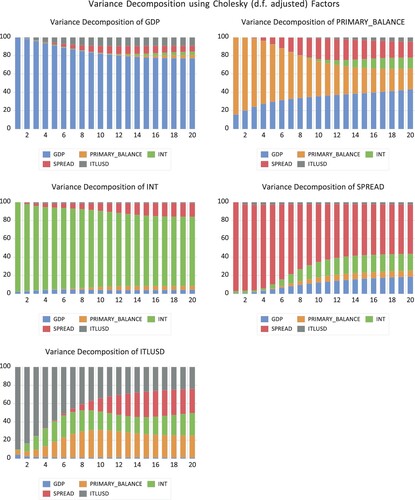
Figure 8. Variance decomposition using Cholesky factors of Model 2 (1980–98).
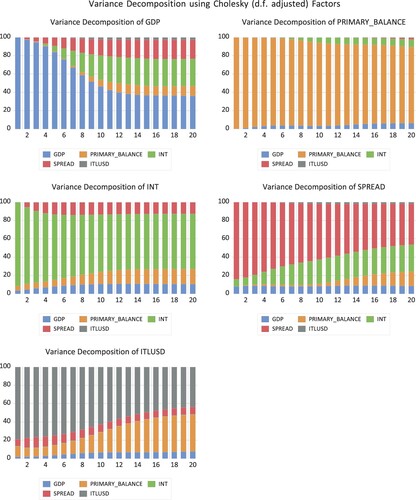
Figure 9 .#Primary revenues and spending of the Italian government as a share of GDP (1980–2018). Source: ISTAT (Citation2019).
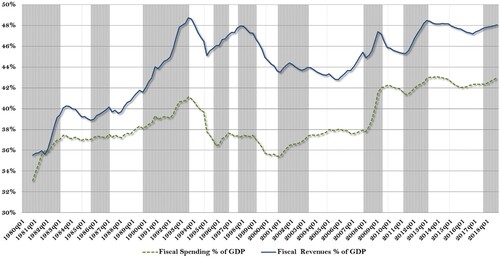
Figure 10. Variance decomposition using Cholesky factors of Model 3 (1980–98).
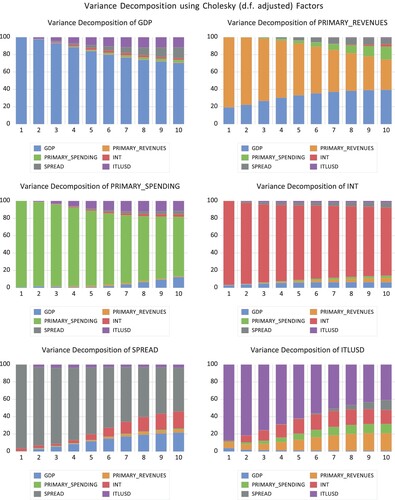
Figure 11. Variance decomposition using Cholesky factors of Model 3 (1999–2018).
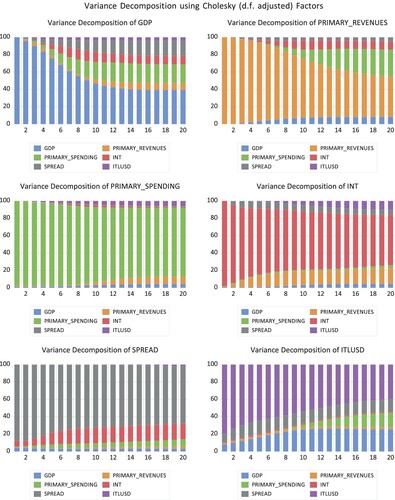
Table A. Johansen Test Model 1.
Table B. VAR Granger causality/block exogeneity Wald tests Model 1.
Table C. Vector error correction estimates Model 1.
Table D. Selection criteria Model 2.
Figure A. Model 2 Impulse responses to innovations of one standard deviation (1980–98).
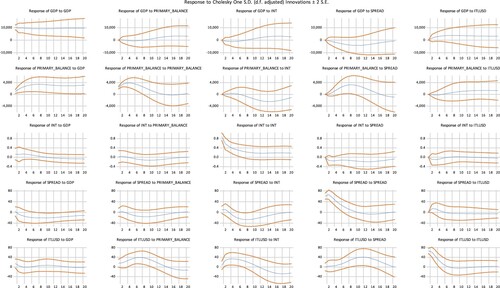
Figure B. Model 2 Impulse responses to innovations of one standard deviation (1999–2018).
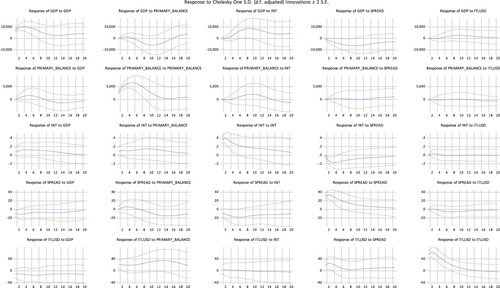
Table E. Selection criteria Model 3.
Figure C. Model 3 Impulse responses to innovations of one standard deviation (1980–98).
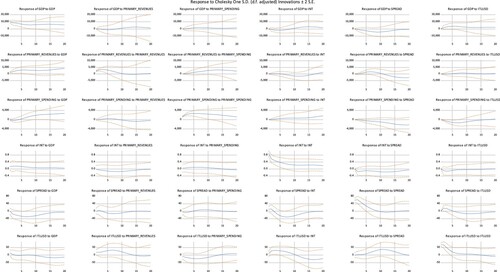
Figure D. Model 3 Impulse responses to innovations of one standard deviation (1999–2018).