
Figures & data
Figure 1. Evolution of macroeconomic, financial, and ecological variables of the baseline scenario.
Note: The initial values of the variables and parameters used in the simulation analysis are reported in Appendices A–C and Table A3.
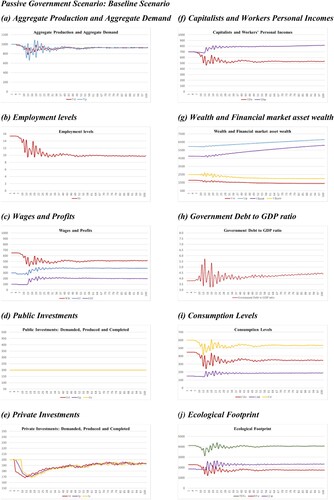
Figure 2. Sensitivity test of the baseline scenario related to the evolution of macroeconomic, financial, and ecological variables.
Note: The initial values of the variables and parameters used in the simulation analysis are reported in Appendices A–C and Table A3.
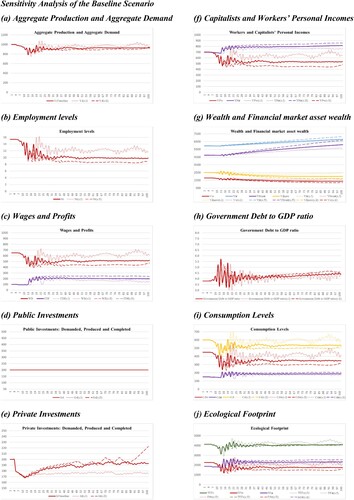
Figure 3. Evolution of macroeconomic, financial, and ecological variables. 0BD (bold lines) versus baseline (dotted lines) scenarios.
Note: The initial values of the variables and parameters used in the simulation analysis are reported in Appendices A–C and Table A3.
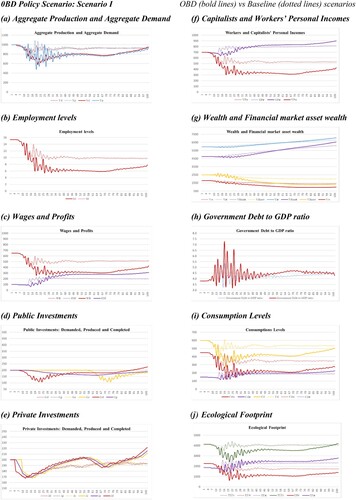
Figure 4. Evolution of macroeconomic, financial, and ecological variables. Proactive (bold lines) versus baseline (dotted lines) scenarios.
Note: The initial values of the variables and parameters used in the simulation analysis are reported in Appendices A–C and Table A3.
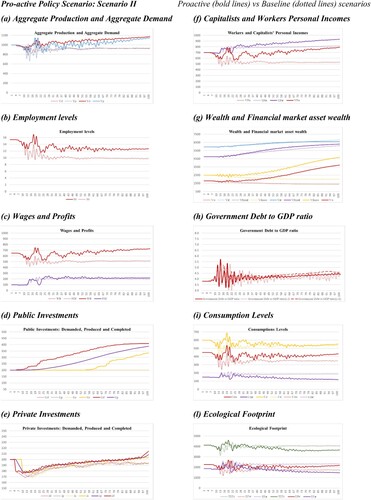
Table A1. Balance sheet matrix.
Table A2. Transaction-flow matrix.
Table A3. Values of the key parameters in the baseline scenario, in the sensitivity test, in scenario I and in scenario II.
Table
Table