Figures & data
Table 1. Predictions of emotions in accordance to different subjective feelings, physiological symptoms and expressive behaviours together with the corresponding variables and interpretation.
Table 2. Variables and interpretation from ISEAR questionnaire.
Figure 1. The flow structure of the emergent self-organising learning with support-vector feature ranking. The SVM is trained using the full set of input data and the ranking criterion is evaluated for feature ranking. The data are then clustered by the ESOM algorithm and such clusters are assigned for classification.
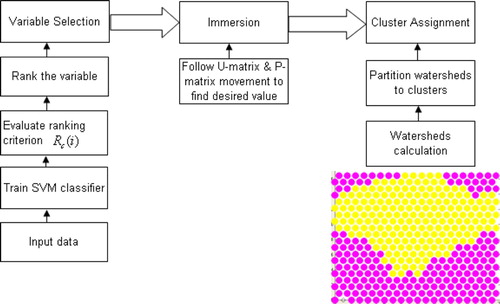
Figure 2. Six basic emotions and neutral expression from JAFEE database (Lyons, Budynek, and Akamatsu Citation1999).
Table 3. Feature ranking by SVESOM for seven different emotions.
Figure 3. The ROC analysis with using top four most discriminative features versus full features in training set of questionnaires emotion data.
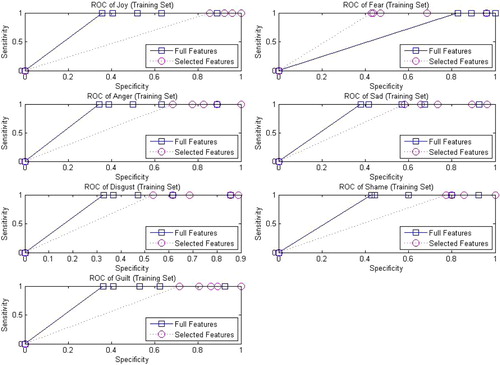
Figure 4. The ROC analysis of using top four most discriminative features versus full features in test set of questionnaires emotion data.
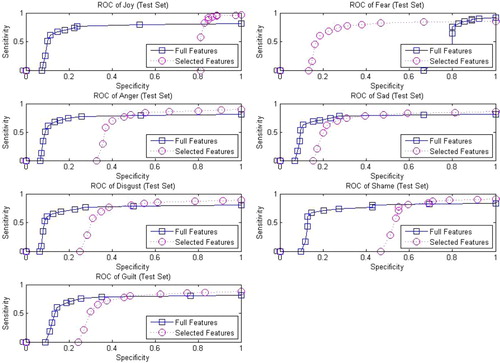
Table 4. Performance result of joy emotion by SVESOM.
Table 5. Performance result of fear emotion by SVESOM.
Table 6. Performance result of disgust emotion by SVESOM.
Table 7. ISEAR benchmarking results between Danisman and Alpkocak Citation(2008) versus our approach.
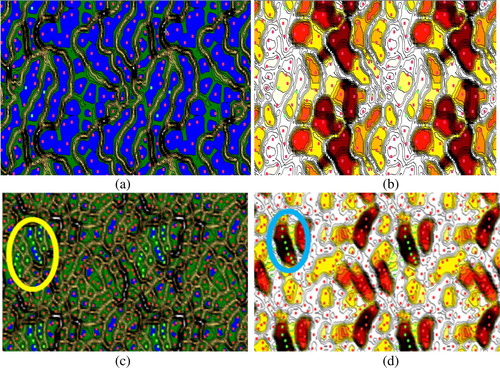
Figure 5. Visualisation of questionnaire emotion data (shame) generated by SVESOM under different numbers of features selected. (a) U-map with two features selected; (b) P-Map with two features selected; (c) U-Map with four features selected; (d) P-Map with four features selected; red points denote data points from majority class, whereas green points represent samples from minority class.