Figures & data
Figure 1. The maze used in the experiments. Each square is a state. The agent starts at S and the reward can (initially) be found at R. For the simulations that test fear extinction and the effect of expectation of return, the end of all non-goal arms in the maze can contain a randomly placed punishment (see text).
Table 1. Control and varied values of different parameters used in the simulations.
Figure 2. Intensity of joy/distress for a single agent, observed in the first 2000 steps. Later intensity of joy is strongly reduced compared to the intensity resulting from the first goal encounter (spike at ).
Figure 3. Intensity of joy/distress, mean over 50 agents, observed in the first 2000 steps. The noisy signal in the first 1000 steps reflects the fact that this is a non-smoothed average of only 50 agents, with each agent producing a spike of joy for the first goal encounter.
Figure 4. Intensity of hope(), mean over 50 agents, observed in the first 2000 steps. Over the course of learning, the hope signal grows to reflect the anticipation of the goal reward, while in the first several hundred trials virtually no hope is present.
Figure 5. Left: intensity of fear, mean over 500 agents, 5000 steps, for four conditions: H/L (high-hope/low-hope), and N/P (punished arms versus no punishment). Fear extincts over time and low-hope agents (Bellman update) generate more fear in the presence of punishment than high-hope agents ( update). Right: zoom-in of Left figure for the first 500 steps.
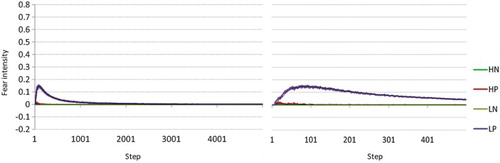
Figure 6. Intensity of hope, mean over 500 agents, 5000 steps, for four conditions: H/L (high-hope/low-hope), and N/P (punished arms versus no punishment). Low-hope agents (Bellman update) perform worse in the presence of punished non-goal maze arms while high-hope () agents perform better in the presence of such punishment.
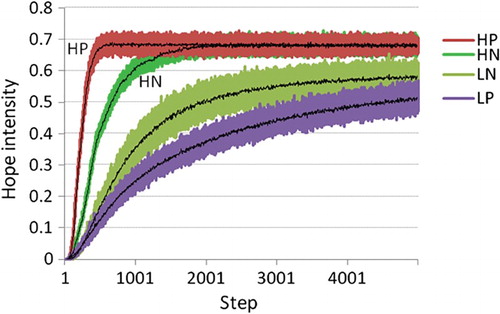
Figure 7. State value interpreted as the agent's “experience”, mean over 500 agents, 500 steps, for four conditions: H/L (high-hope/low-hope), and N/P (punished arms versus no punishment).
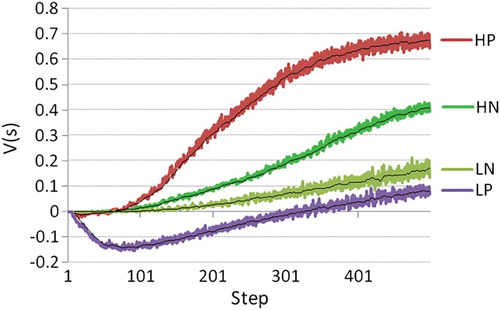
Figure 8. Intensity of joy, mean over 50 agents. Left figure shows the difference between a probability of (first run) versus
(second run) of failing an action. The right figure shows the difference between returning the agent (first run) to its starting position versus relocating the reward (second run).