Figures & data
Figure 1. An example trial from Bulloch and Opfer (Citation2009). The target juvenile (t) is perceptually more similar to (b) but is sometimes presented in a relational context that makes it more similar to (a).
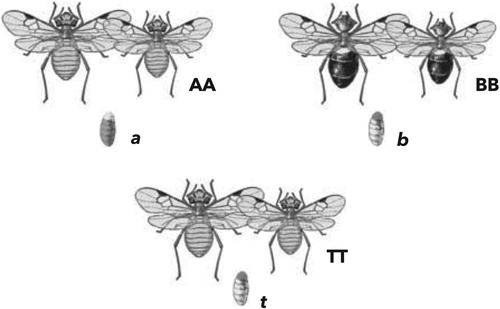
Figure 2. The network architecture and simulation parameters for the feedforward connectionist model, which is an adaptation of the Rumelhart network (Rumelhart, Citation1990). As input the model takes a distributed representation of a juvenile insect (Subject) in a relational context (Relation). These inputs feed forward to two hidden layers: in one (Subject Representation) the model learns an internal representation of the juvenile insects; in the other (Integration) the model learns to combine the two streams of input. The pool of Output units in the model include (a) three adult insects who the juvenile could be “born to,” “eaten by,” and “look like”; (b) three “bug types”; and (c) three “bug properties.”
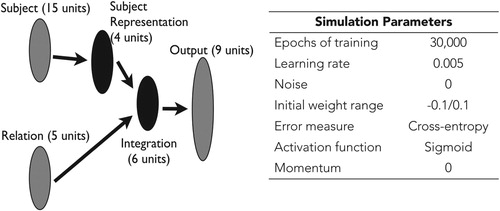
Figure 3. Visualisation of the input representation of the juveniles. Pairwise “perceptual” similarity (overlap of distributed representation) of the six training juveniles is equivalent (r = −.2). Test-juvenile7 is “perceptually” similar to training-juvenile1 and -juvenile2 (r = .4) but equally dissimilar to the others (juveniles 3-6; r = −.2).
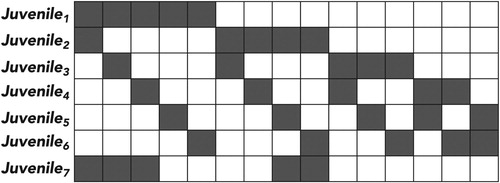
Table 1. Training and Test Patterns.
Figure 4. Mean activation of units that represent the “relational” and “perceptual” inference by context. Error bars denote the standard errors of the means. The left panel shows results from the offspring problems and shows a relational shift: Initially the network makes perceptual inferences and later makes relational inferences. The right panel shows results from the prey problems and does not show a relational shift: It makes the same initial inferences as in the offspring condition, which do not change qualitatively over time.
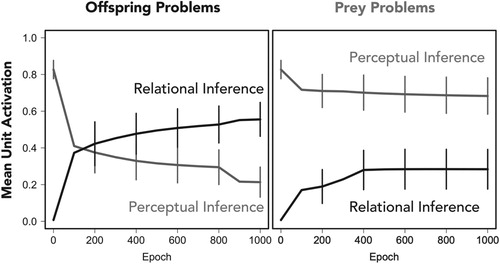
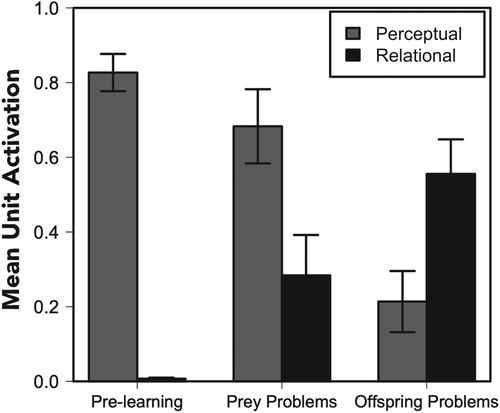
Figure 5. Mean activations of units that reflect “perceptual” and “relational” inferences before learning (left), after learning for the prey problems (middle), and after learning for the offspring problems (right). Error bars denote standard errors of the means.