Figures & data
Figure 1. System model: multi-cast network.
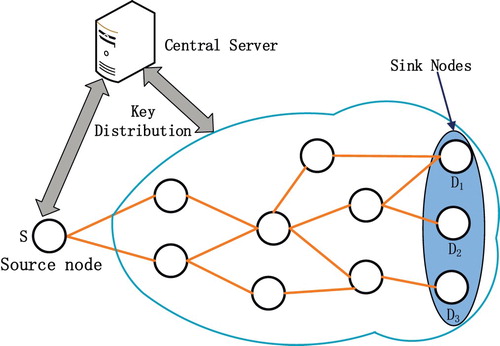
Figure 2. Message coding process.
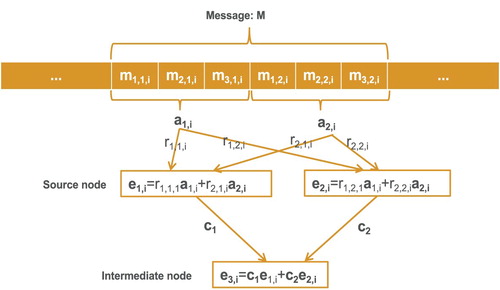
Figure 3. Pollution threats. In Figure , once P is adversary, the bogus message must be generated, and Q or I will receive message
. After that, Q or I will make a combination with
and their own message
or
to generate transmission data
(or
). As the data is polluted, J(or K) can not harvest the source data.
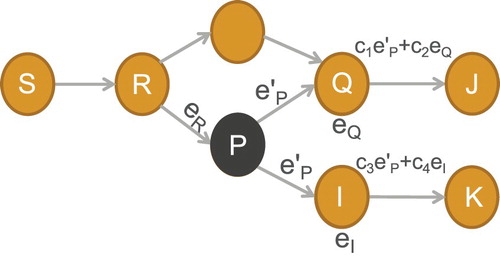
Table 1. Notations.
Figure 4. With no key or illegal key attacks. Suppose M is an adversary, so when bogus data is injected to the network, R immediately advocates that the data from the node M is polluted after verifying the MACs of M.
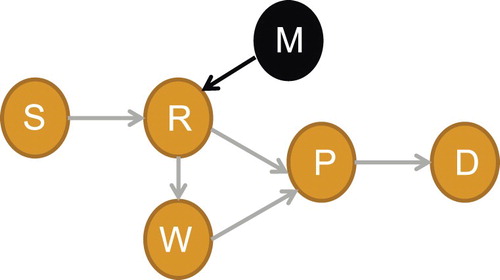
Figure 5. With legal key attacks. Under this situation, there may exist defamation. For example, when P intends to disparage R, it send alerts to SCS and report R as an adversary. In this situation, SCS can quickly make correct judgement by verifying the transmission messages from the node R.
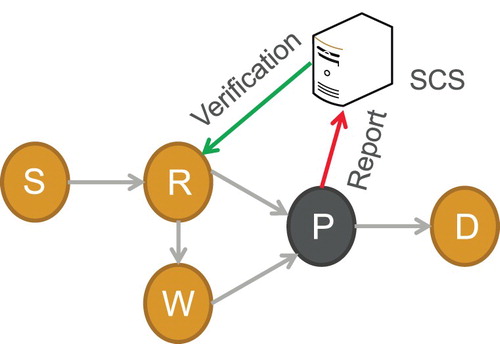
Table 2. Comparison.
Figure 6. Network delay.
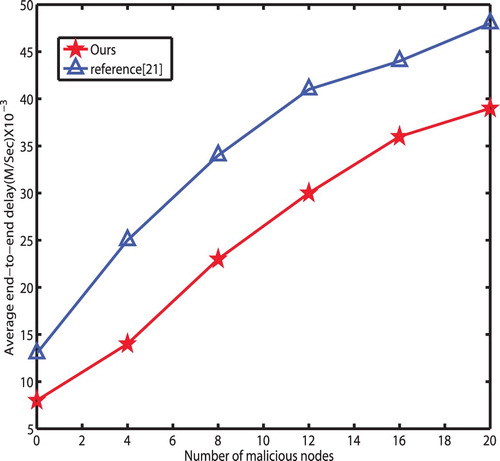
Figure 7. Throughput.
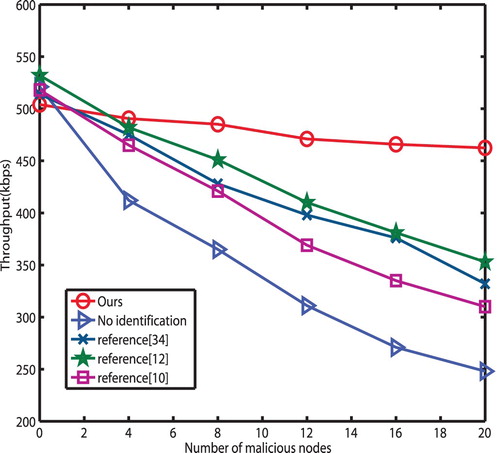
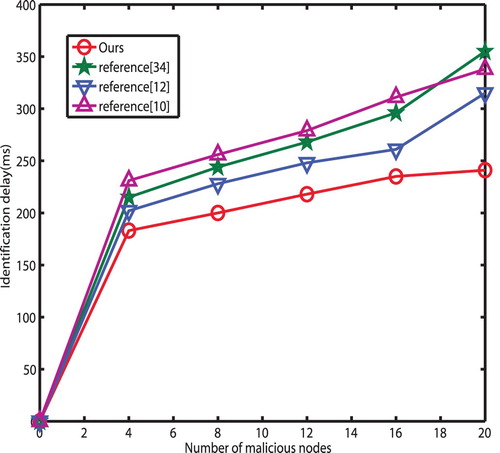
Figure 8. Delay of identification.