Figures & data
Figure 1. Instances distribution over object types.
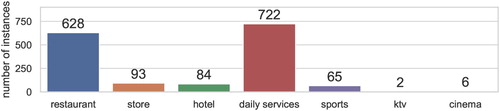
Table 1. Average values and standard deviations of MAE on the whole dataset.
Figure 2. Graphical representation of the average values and standard deviations of MAE on the whole dataset.
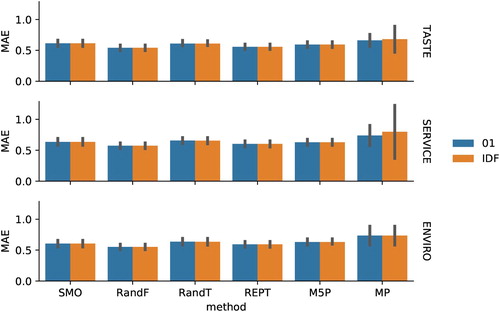
Table 2. Average values and standard deviations of RMSE on the whole dataset.
Figure 3. Graphical representation of the average values and standard deviations of RMSE on the whole dataset.
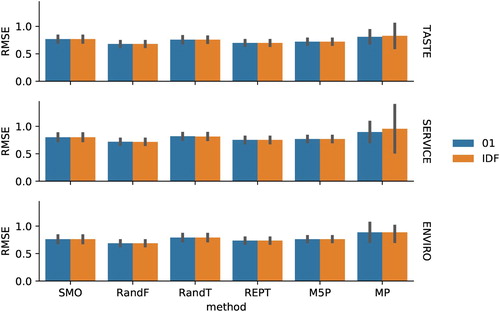
Table 3. Statistically significant wins and losses of MAE and RMSE on whole dataset.
Table 4. Average values and standard deviations of MAE in cluster C3.
Table 5. Average values and standard deviations of RMSE in cluster C3.
Table 6. Statistically significant wins and losses of MAE and RMSE in cluster C3.
Table 7. Average values and standard deviations of MAE in cluster C2.
Table 8. Average values and standard deviations of RMSE in cluster C2.
Table 9. Statistically significant wins and losses of MAE and RMSE in cluster C2.
Table 10. Average values and standard deviations of MAE in cluster C0.
Table 11. Average values and standard deviations of RMSE in cluster C0.
Table 12. Statistically significant wins and losses of MAE and RMSE in cluster C0.
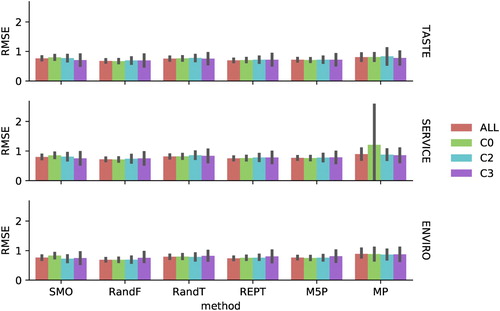
Figure 4. Comparison of the average MAE values and standard deviations obtained for the 01 representation: the whole dataset (ALL) and the clusters (C0, C2, C3).
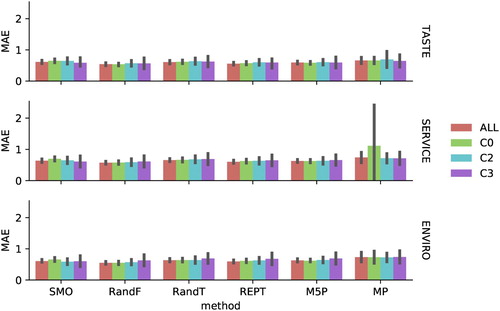
Figure 5. Comparison of the average RMSE values and standard deviations obtained for the 01 representation: the whole dataset (ALL) and the clusters (C0, C2, C3).