
Figures & data
Figure 1. The QoS prediction framework in service selection.
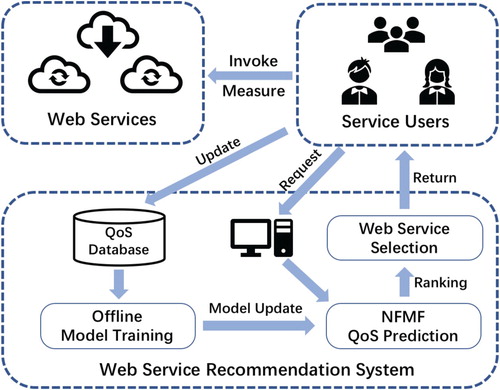
Figure 2. The overall architecture of our model.
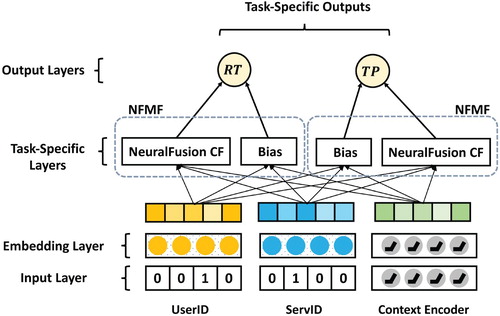
Figure 3. The context encoder network.
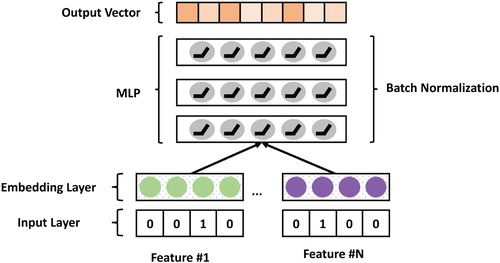
Figure 4. The architecture of neural fusion collaborative filtering.
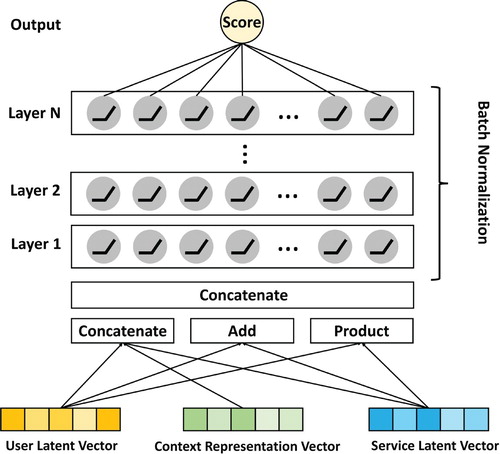
Figure 5. The architecture of bias interaction module.
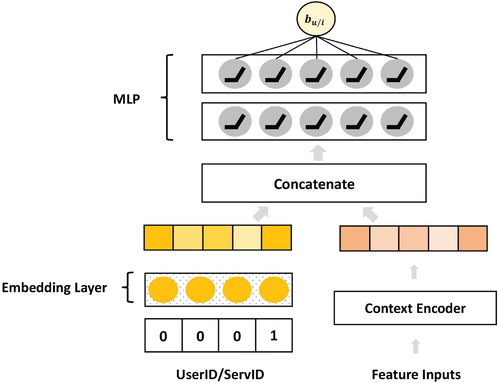
Figure 6. Relationship between RT and TP with different services.In the left figure, it is clear that RTs and TPs have a strong correlation. In the right figure, we can further discover this relation is inverse proportional by multiplying RT and TP from service side.
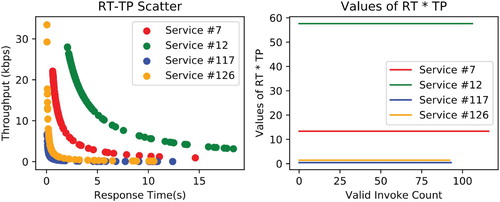
Table 1. Statistics of dataset#1.
Figure 7. Validation accuracy on the training process with different loss functions. As shown in this figure, using L2Loss as the loss function, MAE and RMSE are significantly inferior to those obtained using L1Loss, and the unstable fluctuations of the model can be observed during the training process.
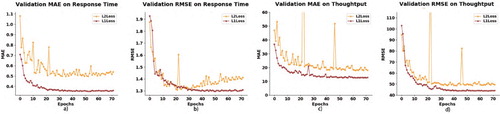
Table 2. Performance comparisons of QoS prediction models on response-time.
Table 3. Performance comparisons of QoS prediction models on throughput.
Table 4. Performance comparisons of QoS prediction models on attritubes response-time and throughput.
Figure 8. Prediction performance of NFMF(Multi-Task) with different dimensionalities and matrix density.
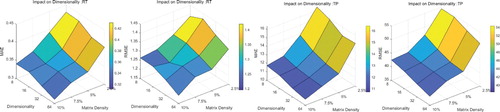
Table 5. Performance with different context.