Figures & data
Figure 1. The system model of blockchain-based cross-user shared auditing.
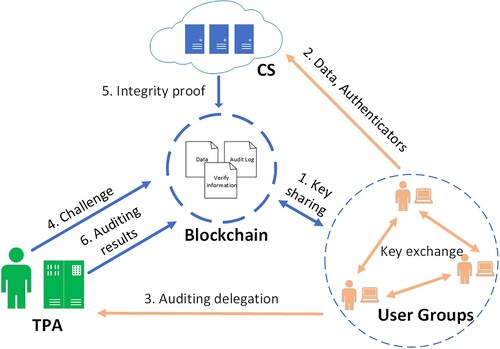
Figure 2. The workflow of BCSAD.
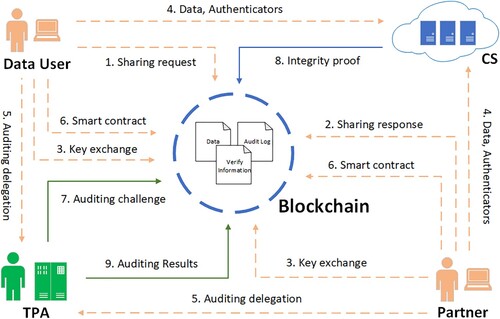
Figure 3. The workflow of BCSAI.
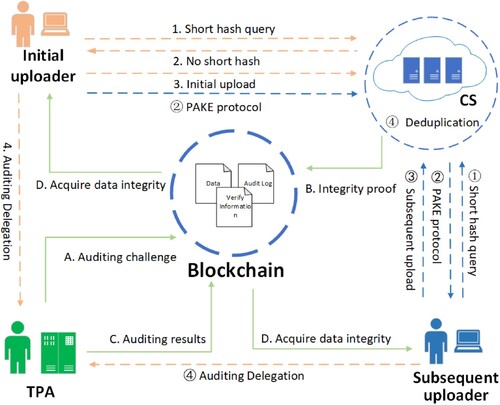
Table 1. Comparisons of functionality.
Table 2. Notions.
Table 3. Comparisons of computation costs.
Table 4. Comparisons of communication and storage costs.
Figure 4. Computation costs of key exchange.
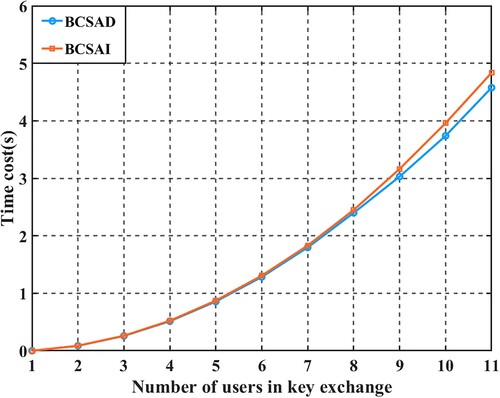
Figure 5. Computation costs of data upload.
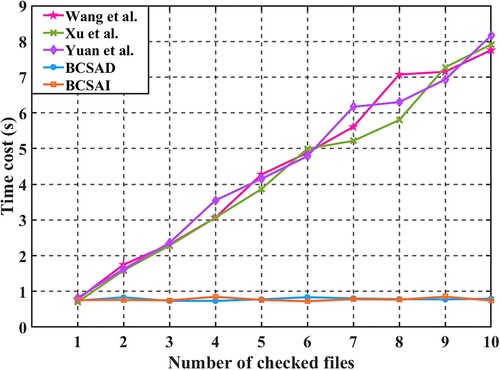
Figure 6. Number of challenged blocks at different block corruption rate.
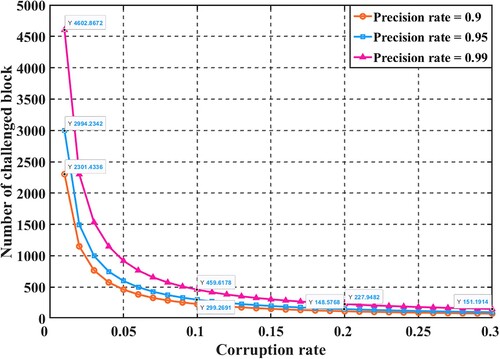
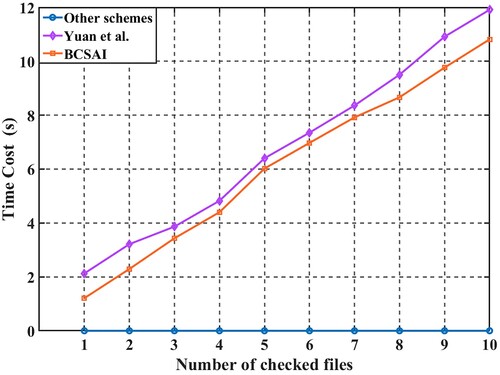
Figure 7. Computation costs of data auditing (5 checked files). (a) Proof generation and (b) proof verification.
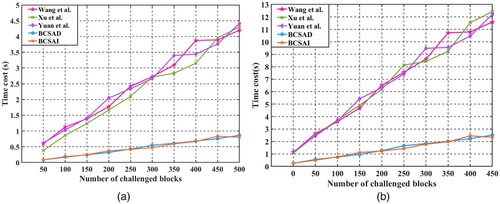
Figure 8. Computation costs of data auditing (460 challenged blocks). (a) Proof generation and (b) proof verification.
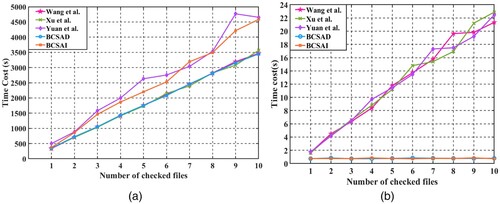
Figure 9. Computation costs of data retrieval.