
Figures & data
Figure 1. (Better viewed in colour) The overview of our proposed architecture STLAT. The target batch in (b) represents the validated samples from target stock and the target batch in (c) represents the training samples from target stock.
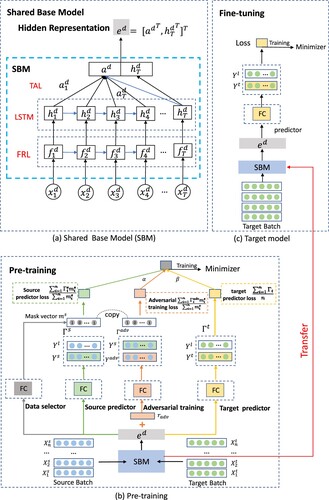
Table 1. Technical features used in the model and their calculation. ma: moving average. roc: rate of change.
Table 2. Experimental results (Acc and MCC) comparison of our model and baselines on three stock benchmarks.
Table 3. Performance with different metrics on ACL18 dataset.
Figure 2. Impact of the perturbation scale.
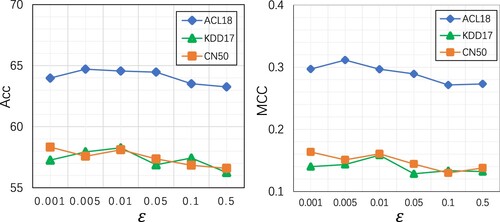
Figure 3. Impact of the time-step lag size.
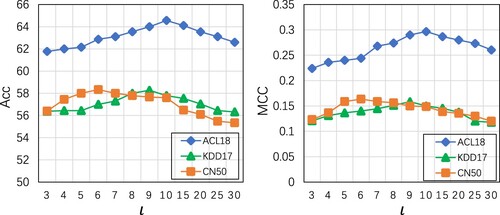
Table 4. Performance in Acc / MCC is reported with four strategies.