Figures & data
Figure 1. (a) Flotation site industrial camera; (b) flotation plant covered by mist; (c) hazy image of the zinc-roughing tank; (d) hazy image of the zinc-refining tank; (e) hazy image of the zinc-scavenging tank.
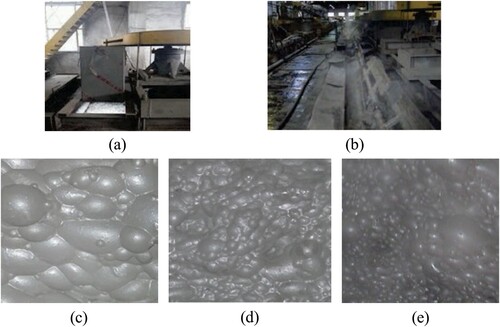
Figure 2. The flowchart of froth foggy image recognition.
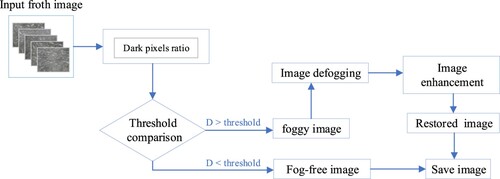
Figure 3. Dark pixel ratio of blur and clear image: (a) clear image; (b) zinc-roughing foggy image; (c) motion blur image; (d) defocus blur image.
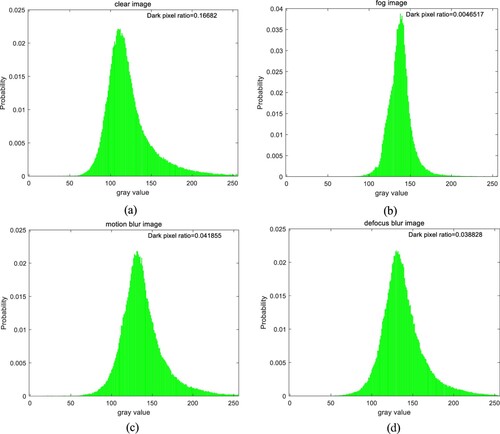
Figure 4. Atmospheric scattering model of flotation foam atomisation image.
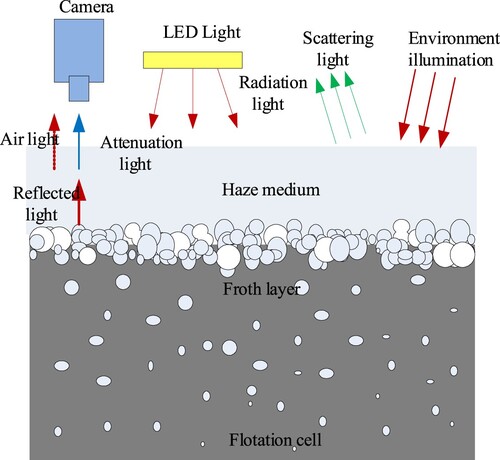
Figure 5. The objective function for finding the optimal transmission value.
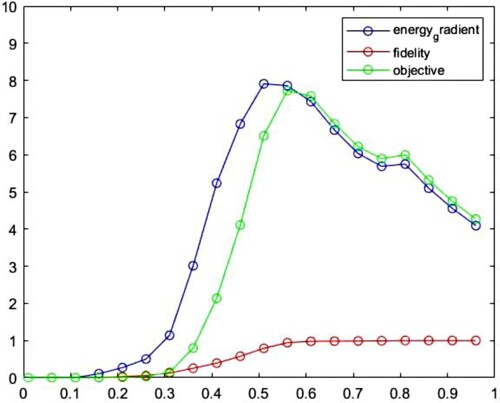
Figure 6. Calculate the transmission map and dehaze processing effect map for the foggy image.
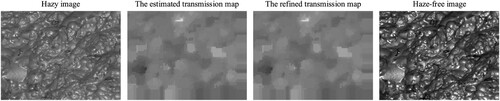
Figure 7. The flow chart of froth images enhancement.
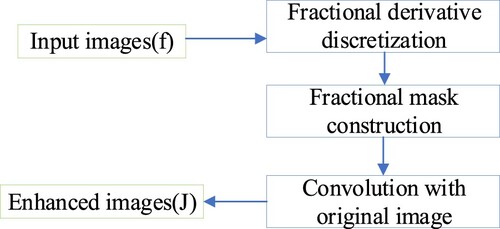
Figure 8. Fractional differential mask construction.
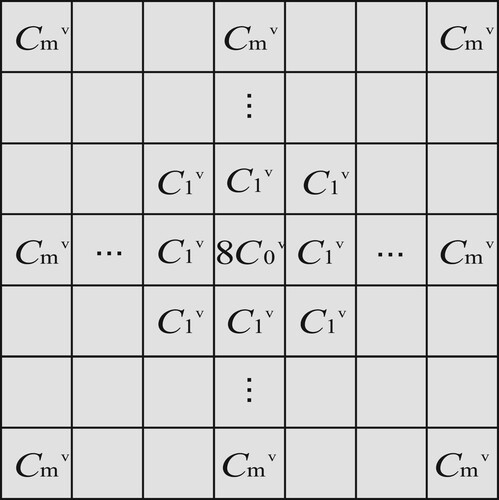
Figure 9. Comparison of different filtering dehazing effects.
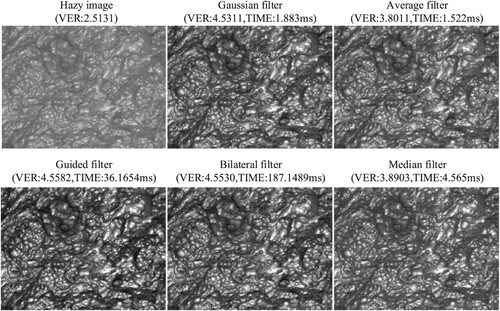
Figure 10. Visible edges of haze image and recovered image.
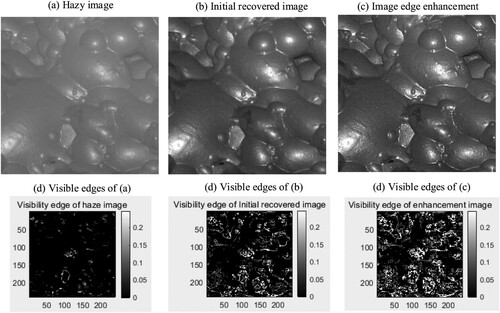
Figure 11. Comparison chart of dehazing effect under different lighting conditions.
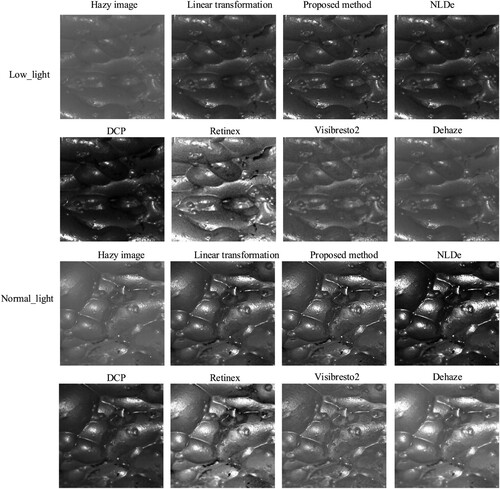
Table 1. Comparison of dehazing time of different algorithms (time unit: s).
Figure 12. Comparison of dehazing effects of different fog densities.
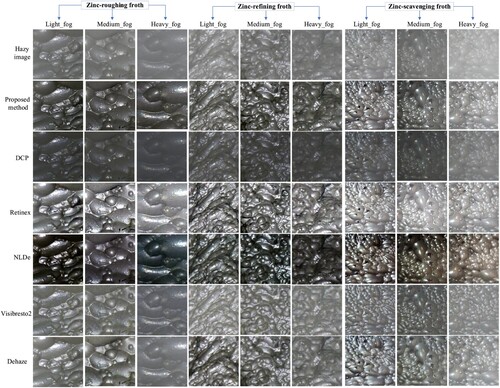
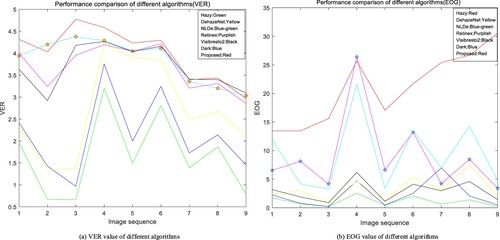
Figure 13. Performance comparison of different algorithms.